DawnODay
Literotica Guru
- Joined
- Dec 19, 2015
- Posts
- 3,120
It is. Ruined.
Um... I take it you did not look at the analytics of that April 2017 poll. The sampling was even more skewed to over-represent Democrats than my examples above.
In the future, unless you want to be simply disregarded, I would suggest that you make sure the links you provide and things you site actually support your position and not, as here, that of the person you're debating.
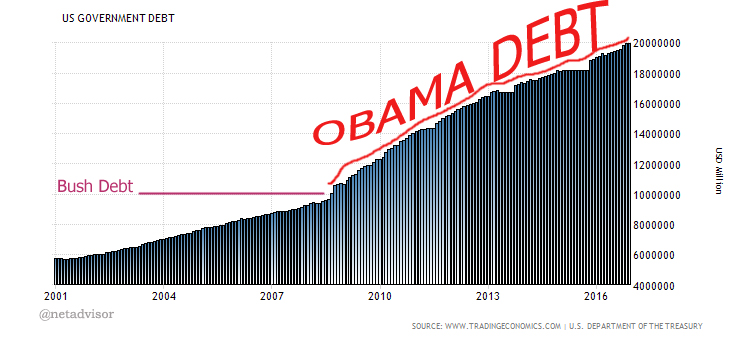
I can misrepresent the size of the debt too. Interesting how you lied about Obamacare and saying polls were manipulated and then you go and use a manipulated graph. Double ruined.

How did I "misrepresent the size of the debt"? Seriously, I don't get your point. It's just a matter of the scale in the X- & Y- axes of the graphs. I trust you know how to read and interpret graphs. I could understand your point were I using logarithmic scaled graphs, but mine, like yours, are straight arithmetic scales, they just cover different intervals. If you are going to use "stock answers," make sure they fit the facts.
Even if the graphs were somehow deceptive, and I still do not see how they could be, I also gave the numbers:
You're right, the Obama economy was a disaster. True, he inherited economic problems after the 2008 real estate crash, but he made the resulting recession longer and deeper than necessary by deficit spending and over-regulation of the economy.
Let's consider a few numbers:
Under Obama:
Lowest labor participation rate since women actively entered the main workforce in the early 1970s.
Record number of people on "Food Stamps."
Worst of all: He almost doubled the Federal deficit from just over $11 trillion to almost $19 trillion in just one administration.
I assume you don't dispute those numbers.
This is worrisome because of the ratio of the Federal debt to the USA's GDP:
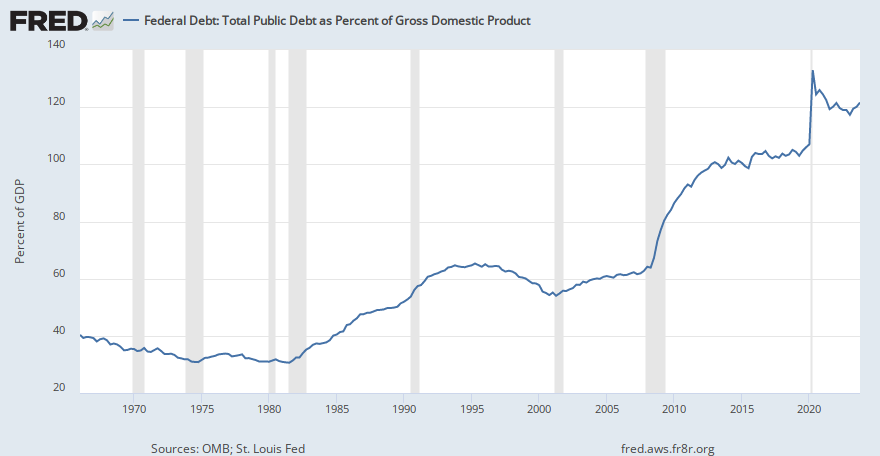
From 2009 to 2016, the USA went from a ~65% debt to GDP ratio to a ~105% debt to GDP ratio. Anything over ~100%, if it persists, and you're looking at Third World economic fundamentals.