8letters
Writing
- Joined
- May 27, 2013
- Posts
- 2,108
If you don’t like discussion of story statistics, HIT BACK NOW!!!!
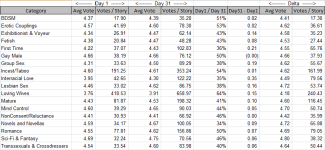
I’ve been collecting 30-Day Voting Top Lists data since 8/30. I’ve got enough data that I’m comfortable sharing it. I’m going to share some tables, explain the tables, and then get into the weeds of the data in the tables.


* I only included those categories that had enough stories that I felt the data was significant
* Columns 2 and 3 are based on the Voting Top Lists data the day after a story has been published
* Column 2 is the average vote on Day 1. This is not the average story rating. Because higher-rated stories typically get more votes, the average story rating will be less than the average vote
* Column 3 is the average number of votes per story on Day 1
* Columns 4 and 5 are the same thing as columns 2 and 3, except on Day 31 after a story is published (yes, the 30-Day Voting Top Lists have 31 days of data)
* Column 6 is the Column 3 divided by Column 5
* Column 7 is the Column 4 minus the Column 2
* Column 8 is (C4*C5-C2*C3)/(C5-C3)
* Column 9 is Column 5 minus Column 3.
Some points from the data above:
* Loving Wives has the highest number of votes and the lowest average vote
* SF&F has the highest average vote
* All categories except Gay Male see a rise in the average vote over time
* Loving Wives has the highest percentage of their voting on the first day
* EC and I/T have a very high percentage of their votes happening on the first day, but those are the two categories that get the most stories so stories will quickly drop off the hub
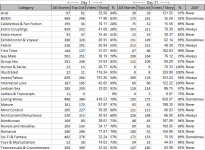
Before I get into the weeds of the data, I want to share one more table:

A story will be on the Voting Top List unless:
1. Voting is disallowed
2. The story has less than 6 votes
3. The story has been pulled
4. For categories that have more than 250 stories that aren’t disqualified for reasons #1, #2 or #3.
Let me walk you through columns on the new table
* Column 1 is all categories
* Column 2 is the number of stories where voting was allowed published from 8/30 to yesterday
* Column 3 is the number of stories from Column 2 that were on the 30-Day Voting Top List the day after they were published
* Column 4 is the total number of votes for stories in Column 3 divided by the number of stories in Column 3
* Column 5 is Column 3 divided by Column 2
* Column 6 is the number of stories where voting was allowed published from 8/30 to 9/18 (31 days prior to today)
* Column 7 is the number of stories from Column 6 that were on the 30-Day Voting Top List the 31st day after they were published
* Column 8 is the total number of votes for stories in Column 6 divided by the number of stories in Column 6
* Column 9 is Column 7 divided by Column 6
* Column 10 “250?” shows how often a category hits the 250 stories limit
Sadly, this last table shows there are lots of problems with the tables I started the post with.
* Only 28% of the stories in C&FF and EC make the top list on their first day; C&FF because so few stories hit the 6 vote threshold and EC because of the 6 vote threshold and the 250 story limit
* Only 53% of the stories in I/T make the the top list on their 31st day because of the 250 story limit
* There’s a lot of information in these tables, but I think there’s enough missing data for enough categories that the first set tables
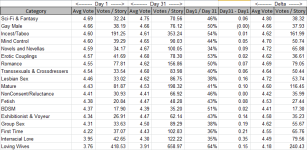
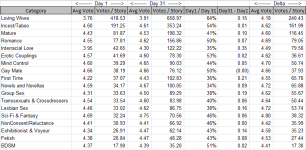
Here are the categories where I think there’s enough data for the numbers to be accurate:

It’s not a lot.
If you'd like to see any of the details behind the numbers, hit me up. I respond more quickly to conversations than thread replies.
I’ve been collecting 30-Day Voting Top Lists data since 8/30. I’ve got enough data that I’m comfortable sharing it. I’m going to share some tables, explain the tables, and then get into the weeds of the data in the tables.


* I only included those categories that had enough stories that I felt the data was significant
* Columns 2 and 3 are based on the Voting Top Lists data the day after a story has been published
* Column 2 is the average vote on Day 1. This is not the average story rating. Because higher-rated stories typically get more votes, the average story rating will be less than the average vote
* Column 3 is the average number of votes per story on Day 1
* Columns 4 and 5 are the same thing as columns 2 and 3, except on Day 31 after a story is published (yes, the 30-Day Voting Top Lists have 31 days of data)
* Column 6 is the Column 3 divided by Column 5
* Column 7 is the Column 4 minus the Column 2
* Column 8 is (C4*C5-C2*C3)/(C5-C3)
* Column 9 is Column 5 minus Column 3.
Some points from the data above:
* Loving Wives has the highest number of votes and the lowest average vote
* SF&F has the highest average vote
* All categories except Gay Male see a rise in the average vote over time
* Loving Wives has the highest percentage of their voting on the first day
* EC and I/T have a very high percentage of their votes happening on the first day, but those are the two categories that get the most stories so stories will quickly drop off the hub
Before I get into the weeds of the data, I want to share one more table:

A story will be on the Voting Top List unless:
1. Voting is disallowed
2. The story has less than 6 votes
3. The story has been pulled
4. For categories that have more than 250 stories that aren’t disqualified for reasons #1, #2 or #3.
Let me walk you through columns on the new table
* Column 1 is all categories
* Column 2 is the number of stories where voting was allowed published from 8/30 to yesterday
* Column 3 is the number of stories from Column 2 that were on the 30-Day Voting Top List the day after they were published
* Column 4 is the total number of votes for stories in Column 3 divided by the number of stories in Column 3
* Column 5 is Column 3 divided by Column 2
* Column 6 is the number of stories where voting was allowed published from 8/30 to 9/18 (31 days prior to today)
* Column 7 is the number of stories from Column 6 that were on the 30-Day Voting Top List the 31st day after they were published
* Column 8 is the total number of votes for stories in Column 6 divided by the number of stories in Column 6
* Column 9 is Column 7 divided by Column 6
* Column 10 “250?” shows how often a category hits the 250 stories limit
Sadly, this last table shows there are lots of problems with the tables I started the post with.
* Only 28% of the stories in C&FF and EC make the top list on their first day; C&FF because so few stories hit the 6 vote threshold and EC because of the 6 vote threshold and the 250 story limit
* Only 53% of the stories in I/T make the the top list on their 31st day because of the 250 story limit
* There’s a lot of information in these tables, but I think there’s enough missing data for enough categories that the first set tables
Here are the categories where I think there’s enough data for the numbers to be accurate:

It’s not a lot.
If you'd like to see any of the details behind the numbers, hit me up. I respond more quickly to conversations than thread replies.
