Stock prices would be high if rates were 'normal' Reuters
May 2, 2015
By Luciana Lopez
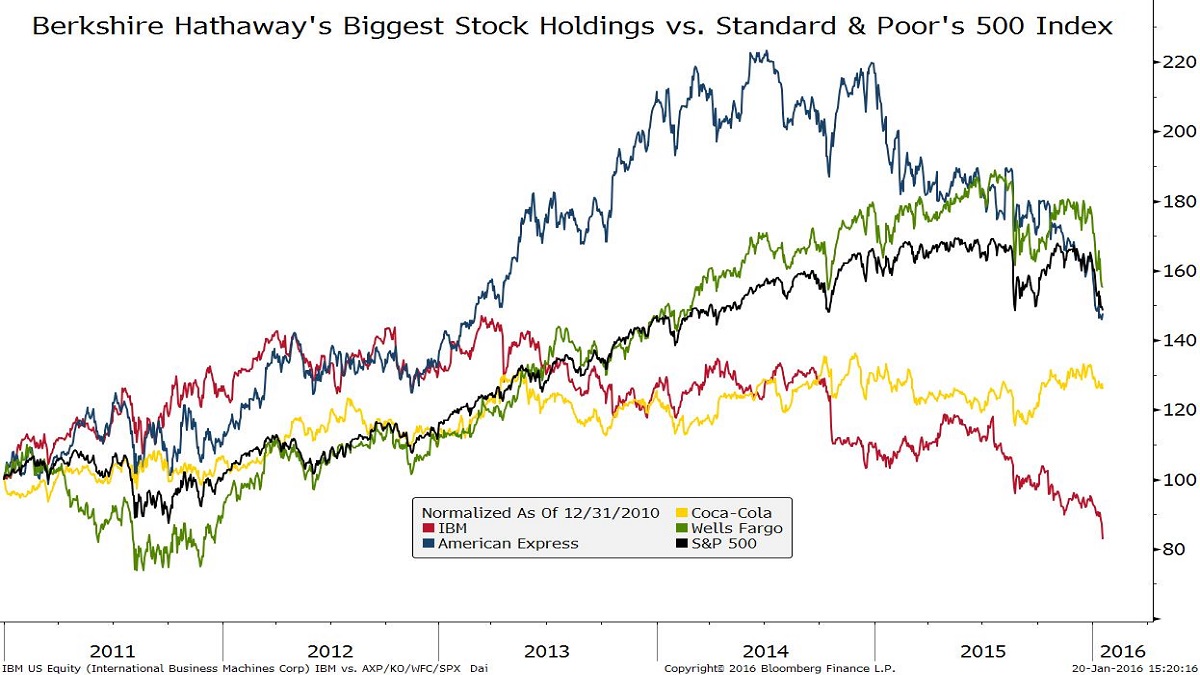
OMAHA, Neb. (Reuters) - Billionaire investor Warren Buffett said on Saturday that stock prices would appear expensive if interest rates normalized from their ultra-low levels.
"If we get back to normal interest rates, stocks at these prices will look high," said Buffett, speaking at the annual shareholders' meeting of his sprawling conglomerate Berkshire Hathaway Inc...
...Regarding the Federal Reserve's loose monetary policy, Buffett said he could not have predicted that rates would remain this low for this long without becoming a problem.
"So far, I have been wrong on interest rates. It's so hard for me to see how, if you toss money from helicopters that eventually you don't have inflation, but we haven't..."
Graphs of stock prices can be way 'over interpreted' - and over-reacted to. As a long term holder of stock I'm at least as interested in size and consistency of dividend income.
Graphs of stock prices can be way 'over interpreted' - and over-reacted to. As a long term holder of stock I'm at least as interested in size and consistency of dividend income.
As a long-term holder of Berkshire Hathaway stock, I have to say that I liked it better when Warren kept his mouth shut and stuck to running the business.
In the old days, he had a very low profile and most people had never heard of him.
I do not see how shooting his mouth off all over the place advances the interests of Berkshire Hathaway.
A brief excerpt from the Letter To Shareholders taken from the 2018 Annual Report of Berkshire Hathaway Corporation
by Warren E. Buffett
"...On March 11th, it will be 77 years since I first invested in an American business. The year was 1942, I was 11, and I went all in, investing $114.75 I had begun accumulating at age six. What I bought was three shares of Cities Service preferred stock. I had become a capitalist, and it felt good.
Let’s now travel back through the two 77-year periods that preceded my purchase. That leaves us starting in 1788, a year prior to George Washington’s installation as our first president. Could anyone then have imagined whattheir new country would accomplish in only three 77-year lifetimes?
During the two 77-year periods prior to 1942, the United States had grown from four million people – about 1⁄2 of 1% of the world’s population – into the most powerful country on earth. In that spring of 1942, though, it faced a crisis: The U.S. and its allies were suffering heavy losses in a war that we had entered only three months earlier. Bad news arrived daily.
Despite the alarming headlines, almost all Americans believed on that March 11th that the war would be won. Nor was their optimism limited to that victory. Leaving aside congenital pessimists, Americans believed that their children and generations beyond would live far better lives than they themselves had led.
The nation’s citizens understood, of course, that the road ahead would not be a smooth ride. It never had been. Early in its history our country was tested by a Civil War that killed 4% of all American males and led President Lincoln to openly ponder whether “a nation so conceived and so dedicated could long endure.” In the 1930s, America suffered through the Great Depression, a punishing period of massive unemployment.
Nevertheless, in 1942, when I made my purchase, the nation expected post-war growth, a belief that proved to be well-founded. In fact, the nation’s achievements can best be described as breathtaking.
Let’s put numbers to that claim: If my $114.75 had been invested in a no-fee S&P 500 index fund, and all dividends had been reinvested, my stake would have grown to be worth (pre-taxes) $606,811 on January 31, 2019 (the latest data available before the printing of this letter). That is a gain of 5,288 for 1.
Meanwhile, a $1 million investment by a tax-free institution of that time – say, a pension fund or college endowment – would have grown to about $5.3 billion.
Let me add one additional calculation that I believe will shock you: If that hypothetical institution had paid only 1% of assets annually to various “helpers,” such as investment managers and consultants, its gain would have been cut in half, to $2.65 billion. That’s what happens over 77 years when the 11.8% annual return actually achieved by the S&P 500 is recalculated at a 10.8% rate..."