The Nobel Prize (for propaganda)

Award-winning Princeton University Physicist Dr. Will Happer, who has published over 200 scientific papers, warned Congress that it has been “badly misinformed” about man-made global warming fears. “Congress has been getting bad intelligence,” Happer, who was reportedly fired by former Vice President Al Gore in 1993 for failing to adhere to Gore’s scientific views, declared in a July 6, 2009 in an interview.

“Congress has been badly misinformed about the so-called science that supports the claim that increasing CO2 levels will bring about catastrophic climate change,” Happer explained to Newsmax.com. Happer did not mince words, calling the movement to promote man-made global warming fears a “climate change cult” and noted that “zealots” promoting climate fears “are actually extremely ignorant.”

“The idea that Congress can stop climate change would be just hilarious if the actions they propose were not so damaging to the American people and even more [damaging] to the poorer people of the world,” Happer said.

“The so-called facts they are getting are just not true,” Happer explained. “This is not a Democrat or Republican issue. As our Congressman learn more about the facts, they will change their minds” and reject man-made climate fears.

Happer noted that “CO2 is not a pollutant. CO2 is essential for life.” He added that the Earth will “be a better place with more CO2.”

Happer testified before the U.S. Senate Environment and Public Works Committee on February 25, 2009 and noted that the Earth was currently in a “CO2 famine.” Happer requested to be added to the U.S. Senate Report of over 700 dissenting scientists on December 22, 2008. Happer also co-authored an Open Letter to Congress with a team of scientists on July 1, 2009 warning: ‘You Are Being Deceived About Global Warming’—‘Earth has been cooling for ten years.’

In addition, Happer has led a group of 54 prominent physicists to demand the American Physical Society (APS) revise its global warming position. The 54 physicists wrote to APS governing board: “Measured or reconstructed temperature records indicate that 20th - 21st century changes are neither exceptional nor persistent, and the historical and geological records show many periods warmer than today.” (Note: Both Nature and Science magazines refused to run the physicists’ open letter.)

In the July 6, 2009 interview, Happer noted that many are poised to benefit from the proposed Congressional carbon trading bill. “History shows you really can get rich on a cult. Some of big pushers of cap-and-trade were Enron before it went belly up,” Happer said.


Jul 01, 2009
Open Letter to Congress
TO THE CONGRESS OF THE UNITED STATES: YOU ARE BEING DECEIVED ABOUT GLOBAL WARMING

You have recently received an Open Letter from the Woods Hole Research Center, exhorting you to act quickly to avoid global disaster. The letter purports to be from independent scientists, but that Center is the former den of the President’s science advisor, John Holdren, and is far from independent. This is the same science advisor who has given us predictions of “almost certain” thermonuclear war or eco-catastrophe by the year 2000, and many other forecasts of doom that somehow never seem to arrive on time.

The facts are:

The sky is not falling; the Earth has been cooling for ten years, without help. The present cooling was NOT predicted by the alarmists’ computer models, and has come as an embarrassment to them.

The finest meteorologists in the world cannot predict the weather two weeks in advance, let alone the climate for the rest of the century. Can Al Gore? Can John Holdren? We are flooded with claims that the evidence is clear, that the debate is closed, that we must act immediately, etc, but in fact

THERE IS NO SUCH EVIDENCE; IT DOESN’T EXIST.

The proposed legislation would cripple the US economy, putting us at a disadvantage compared to our competitors. For such drastic action, it is only prudent to demand genuine proof that it is needed, not guesswork, and not false claims about the state of the science.

DEMAND PROOF, NOT CONSENSUS

Finally, climate alarmism pays well. Many alarmists are profiting from their activism. There are billions of dollars floating around for the taking, and being taken.

< signed >
Robert H. Austin, Ph.D.
Professor of Physics
Princeton University
Fellow APS, AAAS
American Association of Arts and Science
Member National Academy of Sciences

William Happer, Ph.D.
Cyrus Fogg Brackett Professor of Physics
Princeton University
Fellow APS, AAAS
Member National Academy of Sciences

S. Fred Singer, Ph.D.
Professor of Environmental Sciences Emeritus, University of Virginia
First Director of the National Weather Satellite Service
Fellow APS, AAAS, AGU

Roger W. Cohen
Manager, Strategic Planning and Programs, ExxonMobil Corporation (retired)
Fellow APS

Harold W. Lewis, Ph.D.
Professor of Physics Emeritus
University of California at Santa Barbara
Fellow APS, AAAS; Chairman, APS Reactor Safety Study

Laurence I. Gould, Ph.D.
Professor of Physics
University of Hartford
Chairman (2004), New England Section of APS

Richard Lindzen, Ph.D.
Alfred P. Sloan Professor of Meteorology
Massachusetts Institute of Technology
Fellow American Academy of Arts and Sciences, AGU, AAAS, and AMS
Member Norwegian Academy of Science and Letters
Member National Academy of Sciences


http://www.surfacestations.org/

http://wattsupwiththat.com/resources/
 
Last edited:

[ written as he was flying over the Sahara ]

"It is remarkable to think that these treeless desert lands were, half a million years ago, humid tropical forest lands, with now-extinct primates and a rich diversity of plants and animals— a far cry from the impoverished biota that populates the interior of northwestern Africa today.

If the reader is wondering what happened to the rainforest, the unsurprising answer is... global climate change. It is not a new phenomenon: climate change is the rule, not the exception. And climate change was the rule long before humankind came to dominate our earth or to infuse our atmosphere with greenhouse gases. Climate change, extinction, and speciation have been acting in concert for many millenia. Past climate changes in the climate of northern Africa certainly caused local extinction pulses. These have been well documented by paleontologist Scott Wing, who has written of the Koobi Fora flora and fauna— a now vanished humid tropical world in northern Africa."


Bruce M. Beehler, Ph.D.
"Lost Worlds: Adventures In The Tropical Rainforest"
p. 201
Yale University Press
New Haven, 2008

( Dr. Beehler is vice-president of Conservation International )


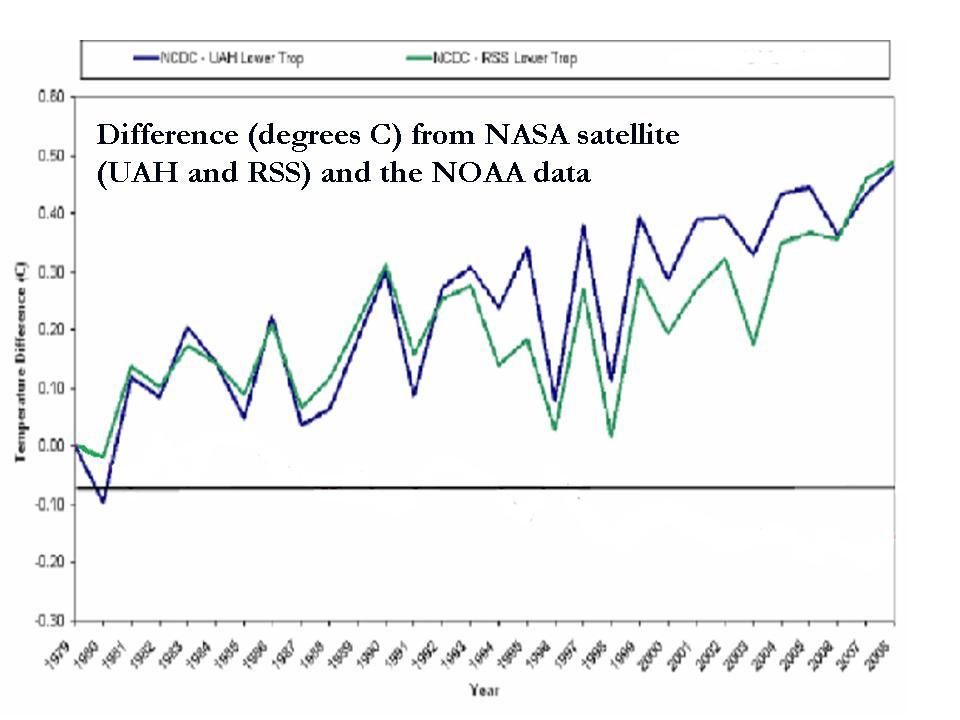
There are some not-dumb people who are convinced that the historic record of temperatures utilized by GISS is badly flawed. Many recording stations have been inspected over the last 5-6 years and found to be horribly flawed ( see: http://www.surfacestations.org and http://wattsupwiththat.com/ ) See also: http://wattsupwiththat.com/2009/07/11/how-not-to-measure-temperature-part-90/#more-9267


In certain locations ( where the observing station is not in an urban area and where the station has been properly maintained ), there has been little-to-no material discernible change in temperatures. For example:
Patuxent River, Maryland
( 1892 - 1990 )

http://data.giss.nasa.gov/cgi-bin/g...py?id=425724040020&data_set=0&num_neighbors=1

NCDC-SAT.jpg


Last edited:
A Layman’s Explanation of Why Global Warming Predictions by Climate Models are Wrong
by: Roy W. Spencer, Ph.D.

I occasionally hear the complaint that some of what I write is too technical to understand, which I’m sure is true. The climate system is complex, and discussing the scientific issues associated with global warming (aka “climate change”) can get pretty technical pretty fast.

Fortunately, the most serious problem the climate models have (in my view) is one which is easily understood by the public. So, I’m going to make yet another attempt at explaining why the computerized climate models tracked by the U.N.’s Intergovernmental Panel on Climate Change (IPCC) – all 23 of them – predict too much warming for our future. The basic problem I am talking about has been peer reviewed and published by us, and so cannot be dismissed lightly.

But this time I will use no graphs (!), and I will use only a single number (!!) which I promise will be a small one.

I will do this in three steps. First, I will use the example of a pot of water on the stove to demonstrate why the temperature of things (like the Earth) rises or falls.

Secondly, I will describe why so many climate model “experts” believe that adding CO2 to the atmosphere will cause the climate system to warm by a large, possibly catastrophic amount.

Finally, I will show how Mother Nature has fooled those climate experts into programming climate models to behave incorrectly.

Some of this material can be found scattered through other web pages of mine, but here I have tried to create a logical progression of the most important concepts, and minimized the technical details. It might be edited over time as questions arise and I find better ways of phrasing things.

The Earth’s Climate System Compared to a Pot of Water on the Stove
Before we discuss what can alter the global-average temperature, let’s start with the simple example of a pot of water placed on a stove. Imagine it’s a gas stove, and the flame is set on its lowest setting, so the water will become warm but will not boil. To begin with, the pot does not have a lid.

Obviously, the heat from the flame will warm the water and the pot, but after about 10 minutes the temperature will stop rising. The pot stops warming when it reaches a point of equilibrium where the rate of heat loss by the pot to its cooler surroundings equals the rate of heat gained from the stove. The pot warmed as long as an imbalance in those two flows of energy existed, but once the magnitude of heat loss from the hot pot reached the same magnitude as the heat gain from the stove, the temperature stopped changing.

Now let’s imagine we turn the flame up slightly. This will result in a temporary imbalance once again between the rate of energy gain and energy loss, which will then cause the pot to warm still further. As the pot warms, it loses energy even more rapidly to its surroundings. Finally, a new, higher temperature is reached where the rate of energy loss and energy gain are once again in balance.

But there’s another way to cause the pot to warm other than to add more heat: We can reduce its ability to cool. If next we place a lid on the pot, the pot will warm still more because the rate of heat loss is then reduced below the rate of heat gain from the stove. In this case, loosely speaking, the increased temperature of the pot is not because more heat is added, but because less heat is being allowed to escape.

Global Warming
The example of what causes a pot of water on a stove to warm is the same fundamental situation that exists with climate change in general, and global warming theory in particular. A change in the energy flows in or out of the climate system will, in general, cause a temperature change. The average temperature of the climate system (atmosphere, ocean, and land) will remain about the same only as long as the rate of energy gain from sunlight equals the rate of heat loss by infrared radiation to outer space...

Again, the average temperature of the Earth (like a pot of water on the stove) will only change when there is an imbalance between the rates of energy gained and energy lost.

What this means is that anything that can change the rates of energy flow illustrated above — in or out of the climate system — can cause global warming or global cooling.

In the case of manmade global warming, the extra carbon dioxide in the atmosphere is believed to be reducing the rate at which the Earth cools to outer space. This already occurs naturally through the so-called “greenhouse effect” of the atmosphere, a process in which water vapor, clouds, carbon dioxide and methane act as a ‘radiative blanket’, insulating the lower atmosphere and the surface, and raising the Earth’s average surface temperature by an average of 33 deg. C (close to 60 deg. F).

The Earth’s natural greenhouse effect is like the lid on our pot of water on the stove. The lid reduces the pot’s ability to cool and so makes the pot of water, on average, warmer than it would be without the lid. (I don’t think you will find the greenhouse effect described elsewhere in terms of an insulator — like a blanket — but I believe that is the most accurate analogy.) Similarly, the Earth’s natural greenhouse effect keeps the lower atmosphere and surface warmer than if there was no greenhouse effect. So, more CO2 in the atmosphere slightly enhances that effect.

And also like the pot of water, the other basic way to cause warming is to increase the rate of energy input — in the case of the Earth, sunlight. Note that this does not necessarily require an increase in the output of the sun. A change in any of the myriad processes that control the Earth’s average cloud cover can also do this. For instance, the IPCC talks about manmade particulate pollution (”aerosols”) causing a change in global cloudiness…but they never mention the possibility that the climate system can change its own cloud cover!

If the amount of cloud cover reflecting sunlight back to space decreases from, say, a change in oceanic and atmospheric circulation patterns, then more sunlight will be absorbed by the ocean. As a result, there will then be an imbalance between the infrared energy lost and solar energy gained by the Earth. The ocean will warm as a result of this imbalance, causing warmer and more humid air masses to form and flow over the continents, which would then cause the land to warm, too.

The $64 Trillion Question: By How Much Will the Earth Warm from More CO2?
Now for a magic number that we will be referring to later, which is how much more energy is lost to outer space as the Earth warms. It can be calculated theoretically that for every 1 deg C the Earth warms, it gives off an average of about 3.3 Watts per square meter more infrared energy to space. Just as you feel more infrared (heat) radiation coming from a hot stove than from a warm stove, the Earth gives off more infrared energy to space the warmer it gets.

This is part of the climate system’s natural cooling mechanism, and all climate scientists agree with this basic fact. What we don’t agree on is how the climate system responds to warming by either enhancing, or reducing, this natural cooling mechanism. The magic number — 3.3 Watts per sq. meter — represents how much extra energy the Earth loses if ONLY the temperature is increased, by 1 deg. C, and nothing else is changed. In the real world, however, we can expect that the rest of the climate system will NOT remain the same in response to a warming tendency.

Thus, the most important debate is global warming research today is the same as it was 20 years ago: How will clouds (and to a lesser extent other elements in the climate system) respond to warming, thereby enhancing or reducing the warming? These indirect changes that further influence temperature are called feedbacks, and they determine whether manmade global warming will be catastrophic, or just lost in the noise of natural climate variability.

Returning to our example of the whole Earth warming by 1 deg. C, if that warming causes an increase in cloud cover, then the 3.3 Watts of extra infrared loss to outer space gets augmented by a reduction in solar heating of the Earth by the sun. The result is a smaller temperature rise. This is called negative feedback...

If negative feedback exists in the real climate system, then manmade global warming will become, for most practical purposes, a non-issue.

But this is not how the IPCC thinks nature works. They believe that cloud cover of the Earth decreases with warming, which would let in more sunlight and cause the Earth to warm to an even higher temperature. (The same is true if the water vapor content of the atmosphere increases with warming, since water vapor is our main greenhouse gas.) This is called positive feedback, and all 23 climate models tracked by the IPCC now exhibit positive cloud and water vapor feedback.

In fact, the main difference between models that predict only moderate warming versus those that predict strong warming has been traced to the strength of their positive cloud feedbacks.

How Mother Nature Fooled the World’s Top Climate Scientists
Obviously, the question of how clouds in the REAL climate system respond to a warming tendency is of paramount importance, because that guides the development and testing of the climate models. Ultimately, the models must be based upon the observed behavior of the atmosphere.

So, what IS observed when the Earth warms? Do clouds increase or decrease? While the results vary with which years are analyzed, it has often been found that warmer years have less cloud cover, not more.

And this has led to the ’scientific consensus’ that cloud feedbacks in the real climate system are probably positive, although by an uncertain amount. And if cloud feedbacks end up being too strongly positive, then we are in big trouble from manmade global warming.

But at this point an important question needs to be asked that no one asks: When the climate system experiences a warm year, what caused the warming? By definition, cloud feedback can not occur unless the temperature changes…but what if that temperature change was caused by clouds in the first place?

This is important because if decreasing cloud cover caused warming, and this has been mistakenly interpreted as warming causing a decrease in cloud cover, then positive feedback will have been inferred even if the true feedback in the climate system is negative.

As far as I know, this potential mix-up between cause and effect — and the resulting positive bias in diagnosed feedbacks — had never been studied until we demonstrated it in a peer-reviewed paper in the Journal of Climate. Unfortunately, because climate research covers such a wide range of specialties, most climate experts are probably not even aware that our paper exists.

So how do we get around this cause-versus-effect problem when observing natural climate variations in our attempt to identify feedback? Our very latest research, now in peer review for possible publication in the Journal of Geophysical Research, shows that one can separate, at least partially, the effects of clouds-causing-temperature-change (which “looks like” positive feedback) versus temperature-causing-clouds to change (true feedback).

We analyzed 7.5 years of our latest and best NASA satellite data and discovered that, when the effect of clouds-causing-temperature-change is accounted for, cloud feedbacks in the real climate system are strongly negative. The negative feedback was so strong that it more than cancelled out the positive water vapor feedback we also found. It was also consistent with evidence of negative feedback we found in the tropics and published in 2007.

In fact, the resulting net negative feedback was so strong that, if it exists on the long time scales associated with global warming, it would result in only 0.6 deg. C of warming by late in this century.

Natural Cloud Variations: The Missing Piece of the Puzzle?
In this critical issue of cloud feedbacks – one which even the IPCC has admitted is their largest source of uncertainty — it is clear that the effect of natural cloud variations on temperature has been ignored. In simplest of terms, cause and effect have been mixed up. (Even the modelers will have to concede that clouds-causing-temperature change exists because we found clear evidence of it in every one of the IPCC climate models we studied.)

But this brings up another important question: What if global warming itself has been caused by a small, long-term, natural change in global cloud cover? Our observations of global cloud cover have not been long enough or accurate enough to document whether any such cloud changes have happened or not. Some indirect evidence that this has indeed happened is discussed here.

Even though they never say so, the IPCC has simply assumed that the average cloud cover of the Earth does not change, century after century. This is a totally arbitrary assumption, and given the chaotic variations that the ocean and atmosphere circulations are capable of, it is probably wrong. Little more than a 1% change in cloud cover up or down, and sustained over many decades, could cause events such as the Medieval Warm Period or the Little Ice Age.

As far as I know, the IPCC has never discussed their assumption that global average cloud cover always stays the same. The climate change issue is so complex that most experts have probably not even thought about it. But we meteorologists by training have a gut feeling that things like this do indeed happen. In my experience, a majority of meteorologists do not believe that mankind is mostly to blame for global warming. Meteorologists appreciate how complex cloud behavior is, and most tend to believe that climate change is largely natural.

Our research has taken this gut feeling and demonstrated with both satellite data and a simple climate model, in the language that climate modelers speak, how potentially serious this issue is for global warming theory.

And this cause-versus-effect issue is not limited to just clouds. For instance, there are processes that can cause the water vapor content of the atmosphere to change, mainly complex precipitation processes, which will then change global temperatures. Precipitation is what limits how much of our main greenhouse gas, water vapor, is allowed to accumulate in the atmosphere, thus preventing a runaway greenhouse effect. For instance, a small change in wind shear associated with a change in atmospheric circulation patterns, could slightly change the efficiency with which precipitation systems remove water vapor, leading to global warming or global cooling. This has long been known, but again, climate change research covers such a wide range of disciplines that very few of the experts have recognized the importance of obscure published studies like this one.

While there are a number of other potentially serious problems with climate model predictions, the mix-up between cause and effect when studying cloud behavior, by itself, has the potential to mostly deflate all predictions of substantial global warming. It is only a matter of time before others in the climate research community realize this, too.
 
Why We Disagree About Climate Change: Understanding Controversy, Inaction and Opportunity ( Mike Hume, Cambridge [UK], 2009 )

Book review by Joseph Bast
24 July, 2009

Having participated in the national and international debate over climate change for more than 15 years, I eagerly bought and read this book in the hope that it would examine the ideas and motives of both sides in the global warming debate. But that is not what this book is about.

The author, Mike Hulme, is a professor of climate change at the University of East Anglia, in the UK. He helped write the influential reports of the Intergovernmental Panel on Climate Change (IPCC) and many other government agencies that are commonly cited by alarmists in the debate. He has been one of the most prominent scientists declaring that “the debate is over” and that man-made global warming will be a catastrophe.

In this book, Hulme comes clean about the uncertain state of scientific knowledge about global warming, something alarmists almost never admit in public. For example, he writes, “the three questions examined above - What is causing climate change? By how much is warming likely to accelerate? What level of warming is dangerous? - represent just three of a number of contested or uncertain areas of knowledge about climate change.” (p. 75)

Later he admits, “Uncertainty pervades scientific predictions about the future performance of global and regional climates. And uncertainties multiply when considering all the consequences that might follow from such changes in climate.” (p. 83) On the subject of the IPCC’s credibility, he admits it is “governed by a Bureau consisting of selected governmental representatives, thus ensuring that the Panel’s work was clearly seen to be serving the needs of government and policy. The Panel was not to be a self-governing body of independent scientists.” (p. 95)

All this is exactly what global warming “skeptics” have been saying for years. It is utterly damning to the alarmists’ case to read these words in a book by one of their most prominent scientists.

How does Hulme justify hiding these truths from the general public? He calls climate change “a classic example of ... `post-normal science,’” and quoting Silvio Funtowicz and Jerry Ravetz, defines this as “the application of science to public issues where `facts are uncertain, values in dispute, stakes high and decisions urgent.’” Issues that are put into the category of “post-normal science” are no longer subject to the cardinal requirements of true science: skepticism, universalism, communalism, and disinterestedness.

In “post-normal science,” consensus substitutes for true science. Political processes run by government bureaucracies, like the IPCC, are created to determine the views of a majority of carefully selected scientists. Any questioning of their statements and claims is dismissed as coming from the “fringe” of the scientific community. From this reasoning comes the claims of James Hansen, Al Gore, and many other alarmists that “the debate is over” and there is “virtually unanimous consensus” about the causes and consequences of global warming, even though according to the rules of true science, and scientists like Mike Hulme, the debate is definitely not over and there is no consensus.

Having freed himself from the restraints of true science, Hulme can indulge his political biases. In another amazing admission, he says his views on global warming are inseparable from his politics--he’s a self-described socialist. He writes, “The idea of climate change should be seen as an intellectual resource around which our collective and personal identities and projects can form and take shape. We need to ask not what we can do for climate change, but to ask what climate change can do for us.” (p. 326)

According to Hulme, climate change can do a lot: “Because the idea of climate change is so plastic, it can be deployed across many of our human projects and can serve many of our psychological, ethical, and spiritual needs.”

In other words, socialists like Hulme can frame the global warming issue to achieve unrelated goals such as sustainable development, income redistribution, population control, social justice, and many other items on the liberal/socialist wishlist.

Like the notorious Stephen Schneider, who once said, “We have to offer up scary scenarios, make simplified, dramatic statements, and make little mention of any doubts one might have. ... Each of us has to decide what the right balance is between being effective and being honest,” Hulme writes, “We will continue to create and tell new stories about climate change and mobilise them in support of our projects.”

These “myths,” he writes, “transcend the scientific categories of `true’ and `false’.” He suggests that his fellow global warming alarmists promote four myths, which he labels Lamenting Eden, Presaging Apocalypse, Constructing Babel, and Celebrating Jubilee.

It is troubling to read a prominent scientist who has so clearly lost sight of his cardinal duty--to be skeptical of all theories and always open to new data. It is particularly troubling when this scientist endorses lying to advance his personal political agenda.
 
http://www.quadrant.org.au/blogs/doomed-planet/2009/07/resisting-climate-hysteria

[ Bolded italics mine ]

“Today’s debate about global warming is essentially a debate about freedom. The environmentalists would like to mastermind each and every possible (and impossible) aspect of our lives.”
Vaclav Klaus, Blue Planet in Green Shackles

Resisting climate hysteria
By Richard S. Lindzen, Ph.D.
Professor, Massachusetts Institute of Technology
Quadrant Magazine, July 26, 2009

A Case Against Precipitous Climate Action

The notion of a static, unchanging climate is foreign to the history of the earth or any other planet with a fluid envelope. The fact that the developed world went into hysterics over changes in global mean temperature anomaly of a few tenths of a degree will astound future generations. Such hysteria simply represents the scientific illiteracy of much of the public, the susceptibility of the public to the substitution of repetition for truth, and the exploitation of these weaknesses by politicians, environmental promoters, and, after 20 years of media drum beating, many others as well.

Climate is always changing. We have had ice ages and warmer periods when alligators were found in Spitzbergen. Ice ages have occurred in a hundred thousand year cycle for the last 700 thousand years, and there have been previous periods that appear to have been warmer than the present despite CO2 levels being lower than they are now. More recently, we have had the medieval warm period and the little ice age. During the latter, alpine glaciers advanced to the chagrin of overrun villages. Since the beginning of the 19th Century these glaciers have been retreating. Frankly, we don’t fully understand either the advance or the retreat...

*****​

References:

Barkstrom, B.R., 1984: The Earth Radiation Budget Experiment (ERBE), Bull. Amer. Meteor. Soc., 65, 1170–1185.

Douglass,D.H., J.R. Christy, B.D. Pearsona and S. F. Singer, 2007: A comparison of tropical temperature trends with model predictions, Int. J. Climatol., DOI: 10.1002/joc.1651

Keenlyside, N.S., M. Lateef, et al, 2008: Advancing decadal-scale climate prediction in the North Atlantic sector, Nature, 453, 84-88.

Lindzen, R.S. and Y.-S. Choi, 2009: On the determination of climate feedbacks from ERBE data, accepted Geophys. Res. Ltrs.

Lindzen, R.S., 2007: Taking greenhouse warming seriously. Energy & Environment, 18, 937-950.

Ramanathan, V., M.V. Ramana, et al, 2007: Warming trends in Asia amplified by brown cloud solar absorption, Nature, 448, 575-578.

Santer, B. D., P. W. Thorne, L. Haimberger, K. E. Taylor, T. M. L. Wigley, J. R. Lanzante, S. Solomon, M. Free, P. J. Gleckler, P. D. Jones, T. R. Karl, S. A. Klein, C. Mears, D. Nychka, G. A. Schmidt, S. C. Sherwood, and F. J. Wentz, 2008: Consistency of modelled and observed temperature trends in the tropical troposphere, Intl. J. of Climatology, 28, 1703-1722.

Smith, D.M., S. Cusack, A.W. Colman, C.K. Folland, G.R. Harris, J.M. Murphy, 2007: Improved Surface Temperature Prediction for the Coming Decade from a Global Climate Model, Science, 317, 796-799.

Tsonis, A. A., K. Swanson, and S. Kravtsov, 2007: A new dynamical mechanism for major climate shifts, Geophys. Res. Ltrs., 34, L13705, doi:10.1029/2007GL030288

Wong, T., B. A. Wielicki, et al., 2006: Reexamination of the observed decadal variability of the earth radiation budget using altitude-corrected ERBE/ERBS nonscanner WFOV Data, J. Climate, 19, 4028–4040.


Richard S. Lindzen is the Alfred P. Sloan Professor of Atmospheric Sciences at Massachusetts Institute of Technology
 
Last edited:
Petitioning for a revised statement on climate change

SIR — We write in response to
your issue discussing “the coming
climate crunch”, including the
Editorial ‘Time to act’ (Nature 459,
1077–1078; 2009). We feel it is
alarmist.

We are among more than 50
current and former members
of the American Physical
Society (APS) who have signed
an open letter to the APS
Council this month, calling for a
reconsideration of its November
2007 policy statement on
climate change (see open letter
at http://*******.com/lg266u;
APS statement at http://*******.com/56zqxr ).
The letter proposes
an alternative statement, which
the signatories believe to be a
more accurate representation of
the current scientific evidence.
It requests that an objective
scientific process be established,
devoid of political or financial
agendas, to help prevent
subversion of the scientific
process and the intolerance
towards scientific disagreement
that pervades the climate issue.
On 1 May 2009, the APS
Council decided to review its
current statement via a highlevel
subcommittee of respected
senior scientists. We applaud
this decision. It is the first such
reappraisal by a major scientific
professional society that we are
aware of, and we hope it will lead
to meaningful change that reflects
a more balanced view of climatechange
issues.

<signed>
S. Fred Singer, Ph.D.
University of Virginia

Hal Lewis
University of California, Santa Barbara

Will Happer, Ph.D.
Princeton University

Larry Gould
University of Hartford

Roger Cohen
Durango, Colorado

Robert H. Austin, Ph.D.
Princeton University
 

Roy W. Spencer, Ph.D. is a former NASA climatologist and well-known skeptic of the theory of anthropogenic global warming.

A recent article on his website contains an interesting description of a non-fossil fuel powered electricity generating facility:


My Favorite Renewable Energy Concept: The Solar Updraft Tower
August 5th, 2009
by Roy W. Spencer, Ph. D.

There are many different ways that you can extract usable energy from sunlight, and they all have their advantages and disadvantages. Historically, the biggest disadvantage has been cost when compared to more traditional sources of energy, such as coal-fired power plants. For if solar power was an economical and practical alternative to other forms of energy generation today, it would already be deployed on a wide scale.

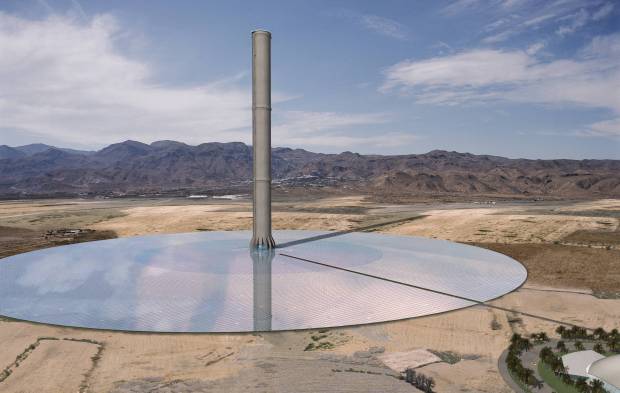
I think it is only a matter of time before renewable energy sources become more cost competitive. The question is which methods make the most sense. My favorite idea is the ‘Solar Tower’ (or ‘solar updraft tower’, or ‘solar chimney’), an artists rendering of which is shown below ( see hotlink below to access the full article ).

Solar-Tower.jpg


While most people have never heard about it, the Solar Tower design was implemented on a small scale in Spain years ago to test the concept. More recently, a privately-funded company called EnviroMission has been working toward the construction of one or more 200 megawatt power plants in the Australian Outback. The company has also been actively pursuing plans to build power plants in China and Nevada.

The design appeals to me because it harnesses the weather, albeit on a small scale. Specifically, it collects the daily production of warm air that forms near the ground, and funnels all of that warm air into a chimney where turbines are located to extract energy from the rising air. It’s a little like wind tower technology, but rather than just extracting energy from whatever horizontally-flowing wind happens to be passing by, the Solar Tower concentrates all of that warm air heated by the ground into the central tower, or chimney, where the air naturally rises. Even on a day with no wind, the solar tower will be generating electricity while conventional wind towers are sitting there motionless.

Full article & illustration:
http://www.drroyspencer.com/2009/08/my-favorite-renewable-energy-concept-the-solar-updraft-tower/
 
CORVALLIS, Ore. – A team of researchers says it has largely put to rest a long debate on the underlying mechanism that has caused periodic ice ages on Earth for the past 2.5 million years – they are ultimately linked to slight shifts in solar radiation caused by predictable changes in Earth’s rotation and axis.

In a publication to be released Friday in the journal Science, researchers from Oregon State University and other institutions conclude that the known wobbles in Earth’s rotation caused global ice levels to reach their peak about 26,000 years ago, stabilize for 7,000 years and then begin melting 19,000 years ago, eventually bringing to an end the last ice age.

The melting was first caused by more solar radiation, not changes in carbon dioxide levels or ocean temperatures, as some scientists have suggested in recent years.
“Solar radiation was the trigger that started the ice melting, that’s now pretty certain,” said Peter Clark, a professor of geosciences at OSU. “There were also changes in atmospheric carbon dioxide levels and ocean circulation, but those happened later and amplified a process that had already begun.”

The findings are important, the scientists said, because they will give researchers a more precise understanding of how ice sheets melt in response to radiative forcing mechanisms. And even though the changes that occurred 19,000 years ago were due to increased solar radiation, that amount of heating can be translated into what is expected from current increases in greenhouse gas levels, and help scientists more accurately project how Earth’s existing ice sheets will react in the future.

“We now know with much more certainty how ancient ice sheets responded to solar radiation, and that will be very useful in better understanding what the future holds,” Clark said. “It’s good to get this pinned down.”

The researchers used an analysis of 6,000 dates and locations of ice sheets to define, with a high level of accuracy, when they started to melt. In doing this, they confirmed a theory that was first developed more than 50 years ago that pointed to small but definable changes in Earth’s rotation as the trigger for ice ages.

“We can calculate changes in the Earth’s axis and rotation that go back 50 million years,” Clark said. “These are caused primarily by the gravitational influences of the larger planets, such as Jupiter and Saturn, which pull and tug on the Earth in slightly different ways over periods of thousands of years.”

That, in turn, can change the Earth’s axis – the way it tilts towards the sun – about two degrees over long periods of time, which changes the way sunlight strikes the planet. And those small shifts in solar radiation were all it took to cause multiple ice ages during about the past 2.5 million years on Earth, which reach their extremes every 100,000 years or so.

Sometime around now, scientists say, the Earth should be changing from a long interglacial period that has lasted the past 10,000 years and shifting back towards conditions that will ultimately lead to another ice age – unless some other forces stop or slow it. But these are processes that literally move with glacial slowness, and due to greenhouse gas emissions the Earth has already warmed as much in about the past 200 years as it ordinarily might in several thousand years, Clark said.

“One of the biggest concerns right now is how the Greenland and Antarctic ice sheets will respond to global warming and contribute to sea level rise,” Clark said. “This study will help us better understand that process, and improve the validity of our models.”

The research was done in collaboration with scientists from the Geological Survey of Canada, University of Wisconsin, Stockholm University, Harvard University, the U.S. Geological Survey and University of Ulster. It was supported by the National Science Foundation and other agencies.

Science 7 August 2009:
Vol. 325. no. 5941, pp. 710 – 714
DOI: 10.1126/science.1172873

The Last Glacial Maximum

Peter U. Clark,1,* Arthur S. Dyke,2 Jeremy D. Shakun,1 Anders E. Carlson,3 Jorie Clark,1 Barbara Wohlfarth,4 Jerry X. Mitrovica,5 Steven W. Hostetler,6 A. Marshall McCabe7

We used 5704 14C, 10Be, and 3He ages that span the interval from 10,000 to 50,000 years ago (10 to 50 ka) to constrain the timing of the Last Glacial Maximum (LGM) in terms of global ice-sheet and mountain-glacier extent. Growth of the ice sheets to their maximum positions occurred between 33.0 and 26.5 ka in response to climate forcing from decreases in northern summer insolation, tropical Pacific sea surface temperatures, and atmospheric CO2. Nearly all ice sheets were at their LGM positions from 26.5 ka to 19 to 20 ka, corresponding to minima in these forcings. The onset of Northern Hemisphere deglaciation 19 to 20 ka was induced by an increase in northern summer insolation, providing the source for an abrupt rise in sea level. The onset of deglaciation of the West Antarctic Ice Sheet occurred between 14 and 15 ka, consistent with evidence that this was the primary source for an abrupt rise in sea level ~14.5 ka.
1 Department of Geosciences, Oregon State University, Corvallis, OR 97331, USA.
2 Geological Survey of Canada, 601 Booth Street, Ottawa, Ontario K1A 0E8, Canada.
3 Department of Geology and Geophysics, University of Wisconsin, Madison, WI 53706, USA.
4 Department of Geology and Geochemistry, Stockholm University, SE-10691, Stockholm, Sweden.
5 Department of Earth and Planetary Sciences, Harvard University, Cambridge, MA 02138, USA.
6 U.S. Geological Survey, Department of Geosciences, Oregon State University, Corvallis, OR 97331, USA.
7 School of Environmental Science, University of Ulster, Coleraine, County Londonderry, BT52 1SA, UK.


WHAT TURNS ICE AGES ON. . . and OFF ?

Research has shown that the amount of sunlight shining on the polar region determines when ice ages occur. Less sunlight shining on the northern polar region has been linked to the last four ice ages. Interglacial periods (time between glacial epochs) occur when the area receives more sunlight. Why? I knew you were going to ask! The amount of sunlight changes due to the orbit of Earth about the sun and the tilt of Earth (23.5 degrees) on its imaginary axis. (It's important to remember these important factors as you read on.) These orbit and tilt variations are due to interactions between Earth, Sun, the moon, and other planets. Scientists refer to this as astronomical forcing.

It is the tilt of Earth's axial rotation that creates seasons. During the summer (warm) season in the Northern Hemisphere, the North Pole is tilted toward the sun and the sun is high in the sky at noon. This allows the sun's rays to come in more perpendicular to the ground on the Northern Hemisphere. During the winter (cold) season in the Northern Hemisphere, the North Pole is tilted away from the sun. The sun stays close to the horizon, and days are short. In the Southern hemisphere, the sun is high in the sky at noon, and days are longer. This is why the seasons are reverse in the two hemispheres. While those of us living in the Northern Hemisphere enjoy summer, our neighbors in the Southern Hemisphere are experiencing winter.

precession_2.jpg

Precession of the rotational axis.
(©1997 Wadsworth Publishing Company/ITP)


Earth wobbles slightly on its axis of rotation, giving rise to a precession, or wobble, with a time period of about 23,000 to 26,000 years. Because Earth "wobbles" (like a spinning top) in space, its tilt changes between 22 and 25 degrees on a cycle of about 41,000 years. That's a long time just to get back to where you started! It's during the periods of less tilt (cooler summers) that scientist believe snow and ice in the high latitudes tend to last (without melting) from year to year. The build-up of this snow and ice from year to year creates massive ice sheets.

Equinox is another term you'll need to be familiar with before you can fully understand present theories on the occurrence of ice ages. An equinox is the time when the sun crosses the equator, making night and day of equal length in all parts of Earth. In the Northern Hemisphere, the vernal (spring) equinox occurs about March 21 and the autumnal (autumn) equinox occurs about September 22. It is during the vernal and autumnal equinoxes that the sun is overhead at the equator throughout the day. In other words, the angle of incidence of the sun's rays to Earth's surface at noon on the equator is 90 degrees. The sun's rays at the equator at noon are perpendicular to Earth's surface.

axis_wobble_2.jpg

The tilt of the Earth's rotational axis changes over a period of time.

Changes in the degree of Earth's tilt can cause the seasons to become more or less severe. More tilt would result in colder winters and hotter summers, while less tilt would result in cooler summers and milder winters. Other processes are also important. During ice ages, snow and ice bulid up on the land close to the poles.

Because of this build-up, more of Earth is covered with ice and snow giving it more albedo. In simpler terms, the whiteness of the snow and ice reflects the sun's energy back into space. Thus, more cooling takes place. As the ice sheets continue to grow, scientists also believe less carbon dioxide is in the atmosphere. This adds to the cooling process.

orbit_eccentricity_2.jpg

The above image shows how much the Earth's orbit can vary in shape.
This process in a slow one, taking roughly 100,000 years to cycle.


Earth's orbit (path around the sun) is slightly elliptical (oval-shaped). This means that Earth is slightly closer to the sun during some parts of its year-long orbit and further away at other times. The closest approach of Earth to the sun is called perihelion, and it now occurs in January, making Northern Hemisphere winters slightly warmer. Eleven thousand years ago, perihelion occurred in July, making the summer slightly warmer in the Arctic.

Periodic changes in the "roundness" of Earth's orbit varies in cycles of 100,000 to 400,000 years. This affects how important "timing of the perihelion" is to the strength of the seasons. The growth and retreat of ice sheets are thought to be controlled by the combination of:

the tilt cycle which takes 41,000 years from onset to completion

the year precession cycle which is 26,000 years, and

the perhaps smaller effect of Earth's orbit eccentricities (non-circular and elliptical) cycle which can take 100,000 to 400,000 years for completion.

This seems reasonable as each of these cycles has a definite effect on the severity of the summer and winter seasons.

Ice cores obtained by boring deep into Earth's ice sheets provide scientists with information of Earth's paleoclimate. Two ice cores through the Greenland ice sheet have provided a continuous record of atmospheric conditions over Greenland from abut 100,000 years ago to present time. The ice cores show remarkable temperature variability (changes) over the past 100,000 years with rapid warming and cooling of the northern hemisphere, sometimes within decades (tens of years).

http://oceanworld.tamu.edu/students/iceage/iceage2.htm
 
DOES THIS GUY REALIZE THAT HE'S NOT EVEN CLOSE?

Senator John Kerry’s statement in early August 2009 about “global warming” before the Senate Foreign Relations Committee, which he chairs, was false in every particular, leading him to draw the incorrect conclusion that “global warming” was a threat to national security. The Senator got every fact wrong –

Wilkins Ice Shelf: Senator Kerry said the recent cracking of the thin “ice-bridge” linking the Wilkins Ice Shelf to the Antarctic Ice Shelf was caused by “global warming”. It was not: there has been no statistically-significant “global warming” for almost 15 years.

Arctic ice-cap: Senator Kerry said the Arctic ice-cap would vanish in summer by 2013 because of “global warming”. It will not, and, even if it does, “global warming” will not be the cause: there has been rapid global cooling for very nearly eight years.

Polar bears: Senator Kerry said polar bears were under threat from “global warming”. They are not: their population has increased fivefold since the 1940s, and they survived the last interglacial period 125,000 years ago, when there was no summer ice in the Arctic.

Famine and drought: Senator Kerry said “global warming” would bring more famine and drought. It will not: “global warming”, if and when it resumes, would cause the space occupied by the atmosphere to hold more water vapor, reducing drought globally.

Pandemics: Senator Kerry said “global warming” would cause worse pandemics. It will not: so-called “tropical” diseases can flourish even in Arctic temperatures. It is inadequate public-health measures, not rising global temperatures, that spread supposedly “tropical” diseases.

Natural disasters: Senator Kerry said “global warming” would cause more natural disasters. It will not: hurricane activity is now at its lowest in half a century, despite warmer weather worldwide; and patterns of flood and drought are much as they always were.

Climate refugees: Senator Kerry said “global warming would cause human displacement on “a staggering scale”. It will not: the only significant cause of human displacement would be rapidly-rising sea level, but this is not happening and is not likely to happen.

Middle East water supply: Senator Kerry said “global warming” would shrink the water supply in the Middle East. It will not: water has been scarce there for 1000 years, and warmer weather is already moistening the atmosphere and greening hundreds of thousands of square kilometers of the Sahara.

Asian water supply: Senator Kerry said “global warming” would melt the Himalayan glaciers, drying up the water supply of a quarter of the planet’s population. It will not: it is Eurasian winter snow cover, not the glaciers, that supplies Asia with its water, and that shows no trend in 50 years.

Sea level rising 3 feet: Senator Kerry said “global warming” would raise sea level 3 feet. It will not: sea level rose 8 inches in the 20th century, is currently not rising at all, and will rise by little more than 1 foot in the 21st century.
 
... In his notes he makes this mention:
Is the debate over? – The loudest Alarmist says the debate is over. However, “It is error only, and not truth, that shrinks from inquiry”.


By the “loudest alarmist” he probably means Al Gore.


Burt Rutan ( yes, THAT Burt Rutan http://en.wikipedia.org/wiki/Burt_Rutan ):
http://en.wikipedia.org/wiki/Rutan_Voyager

Final two slides of the PowerPoint presentation given below:

rutan_observations.png


rutan_recommendations.png


Complete PowerPoint presentation:
http://rps3.com/Pages/Burt_Rutan_on_Climate_Change.htm


Last edited:
Thanks to Trysail and others, there is more general information available to everyone because of the hysteria by the ecological terrorists.

(Not that anyone cares to educate themselves)

Amicus


Before you extoll solar energy or wind energy as the solution to all of the world's energy problems, be certain you understand the magnitudes involved.

Most people don't.

http://icecap.us/images/uploads/Poster-ScaleofPowerGeneration.pdf

If you expect to be taken seriously as a commentator, it is necessary that you demonstrate a comprehension of the scale, size and scope of energy production. If you don't demonstrate a command of the quantities, don't be surprised if your opinions are discounted or ignored.


grnmhse85.jpg
 
Last edited:
Most of the literate world today regards "global warming'' as both real and dangerous. Indeed, the diplomatic activity concerning warming might lead one to believe that it is the major crisis confronting mankind. The June 1992 Earth Summit in Rio de Janeiro, Brazil, focused on international agreements to deal with that threat, and the heads of state from dozens of countries attended. I must state at the outset, that, as a scientist, I can find no substantive basis for the warming scenarios being popularly described. Moreover, according to many studies I have read by economists, agronomists, and hydrologists, there would be little difficulty adapting to such warming if it were to occur. Such was also the conclusion of the recent National Research Council's report on adapting to global change. Many aspects of the catastrophic scenario have already been largely discounted by the scientific community. For example, fears of massive sea-level increases accompanied many of the early discussions of global warming, but those estimates have been steadily reduced by orders of magnitude, and now it is widely agreed that even the potential contribution of warming to sea-level rise would be swamped by other more important factors.

To show why I assert that there is no substantive basis for predictions of sizeable global warming due to observed increases in minor greenhouse gases such as carbon dioxide, methane, and chlorofluorocarbons, I shall briefly review the science associated with those predictions.

Summary of Scientific Issues

Before even considering "greenhouse theory,'' it may be helpful to begin with the issue that is almost always taken as a given--that carbon dioxide will inevitably increase to values double and even quadruple present values. Evidence from the analysis of ice cores and after 1958 from direct atmospheric sampling shows that the amount of carbon dioxide in the air has been increasing since 1800. Before 1800 the density was about 275 parts per million by volume. Today it is about 355 parts per million by volume. The increase is generally believed to be due to the combination of increased burning of fossil fuels and before 1905 to deforestation. The total source is estimated to have been increasing exponentially at least until 1973. From 1973 until 1990 the rate of increase has been much slower, however. About half the production of carbon dioxide has appeared in the atmosphere.

Predicting what will happen to carbon dioxide over the next century is a rather uncertain matter. By assuming a shift toward the increased use of coal, rapid advances in the third world's standard of living, large population increases, and a reduction in nuclear and other nonfossil fuels, one can generate an emissions scenario that will lead to a doubling of carbon dioxide by 2030--if one uses a particular model for the chemical response to carbon dioxide emissions. The Intergovernmental Panel on Climate Change Working Group I's model referred to that as the "business as usual'' scenario. As it turns out, the chemical model used was inconsistent with the past century's record; it would have predicted that we would already have about 400 parts per million by volume. An improved model developed at the Max Planck Institute in Hamburg shows that even the "business as usual'' scenario does not double carbon dioxide by the year 2100. It seems unlikely moreover that the indefinite future of energy belongs to coal. I also find it difficult to believe that technology will not lead to improved nuclear reactors within fifty years.

Nevertheless, we have already seen a significant increase in carbon dioxide that has been accompanied by increases in other minor greenhouse gases such as methane and chlorofluorocarbons. Indeed, in terms of greenhouse potential, we have had the equivalent of a 50 percent increase in carbon dioxide over the past century. The effects of those increases are certainly worth studying--quite independent of any uncertain future scenarios.

...

Modelling and Societal Instability

So far I have emphasized the political elements in the current climate hysteria. There can be no question, however, that scientists are abetting this situation. Concerns about funding have already been mentioned. There is, however, another perhaps more important element to the scientific support. The existence of modern computing power has led to innumerable modelling efforts in many fields. Supercomputers have allowed us to consider the behavior of systems seemingly too complex for other approaches. One of those systems is climate. Not surprisingly, there are many problems involved in modelling climate. For example, even supercomputers are inadequate to allow long-term integrations of the relevant equations at adequate spatial resolutions. At presently available resolutions, it is unlikely that the computer solutions are close to the solutions of the underlying equations. In addition, the physics of unresolved phenomena such as clouds and other turbulent elements is not understood to the extent needed for incorporation into models. In view of those problems, it is generally recognized that models are at present experimental tools whose relation to the real world is questionable.

While there is nothing wrong in using those models in an experimental mode, there is a real dilemma when they predict potentially dangerous situations. Should scientists publicize such predictions since the models are almost certainly wrong? Is it proper to not publicize the predictions if the predicted danger is serious? How is the public to respond to such predictions? The difficulty would be diminished if the public understood how poor the models actually are. Unfortunately, there is a tendency to hold in awe anything that emerges from a sufficiently large computer. There is also a reluctance on the part of many modellers to admit to the experimental nature of their models lest public support for their efforts diminish. Nevertheless, with poor and uncertain models in wide use, predictions of ominous situations are virtually inevitable--regardless of reality.

Such weak predictions feed and contribute to what I have already described as a societal instability that can cascade the most questionable suggestions of danger into major political responses with massive economic and social consequences. I have already discussed some of the reasons for this instability: the existence of large cadres of professional planners looking for work, the existence of advocacy groups looking for profitable causes, the existence of agendas in search of saleable rationales, and the ability of many industries to profit from regulation, coupled with an effective neutralization of opposition. It goes almost without saying that the dangers and costs of those economic and social consequences may be far greater than the original environmental danger. That becomes especially true when the benefits of additional knowledge are rejected and when it is forgotten that improved technology and increased societal wealth are what allow society to deal with environmental threats most effectively. The control of societal instability may very well be the real challenge facing us.

Richard S. Lindzen, Ph.D.
Alfred P. Sloan Professor of Meteorology
Massachusetts Institute of Technology
Fellow American Academy of Arts and Sciences, AGU, AAAS, and AMS
Member Norwegian Academy of Science and Letters
Member National Academy of Sciences

http://www.cato.org/pubs/regulation/.../reg15n2g.html


And— I hasten to add— these computer models are brought to you by the very same people** who created the models upon which all those lovely mortgage-backed securities were based.

____________________________

** Lest you think I jest— in the early part of this decade, it was common Wall Street practice to hire freshly minted "rocket scientists" to design and construct the impossibly complex computer simulations utilized by Wall Street to package and sell the mortgage-backed securities that all of us have come to rue.


Last edited:
August 27, 2009
Source: Woods Hole Oceanographic Institution
http://www.whoi.edu/page.do?pid=7545&tid=282&cid=59106&ct=162


A new 2,000-year-long reconstruction of sea surface temperatures (SST) from the Indo-Pacific warm pool (IPWP) suggests that temperatures in the region may have been as warm during the Medieval Warm Period as they are today.

The IPWP is the largest body of warm water in the world, and, as a result, it is the largest source of heat and moisture to the global atmosphere, and an important component of the planet’s climate. Climate models suggest that global mean temperatures are particularly sensitive to sea surface temperatures in the IPWP. Understanding the past history of the region is of great importance for placing current warming trends in a global context.

The study is published in the journal Nature.

In a joint project with the Indonesian Ministry of Science and Technology (BPPT), the study’s authors, Delia Oppo, a paleo–oceanographer with the Woods Hole Oceanographic Institution, and her colleagues Yair Rosenthal of Rutgers State University and Braddock K. Linsley of the University at Albany-State University of New York, collected sediment cores along the continental margin of the Indonesian Seas and used chemical analyses to estimate water past temperatures and date the sediment. The cruise included 13 US and 14 Indonesian scientists.

“This is the first record from the region that has really modern sediments and a record of the last two millennia, allowing us to place recent trends in a larger framework,” notes Oppo.

Global temperature records are predominantly reconstructed from tree rings and ice cores. Very little ocean data are used to generate temperature reconstructions, and very little data from the tropics. “As palaeoclimatologists, we work to generate information from multiple sources to improve confidence in the global temperature reconstructions, and our study contributes to scientists’ efforts towards that goal,” adds Oppo.

Temperature reconstructions suggest that the Northern Hemisphere may have been slightly cooler (by about 0.5 degrees Celsius) during the 'Medieval Warm Period' (~AD 800-1300) than during the late-20th century. However, these temperature reconstructions are based on, in large part, data compiled from high latitude or high altitude terrestrial proxy records, such as tree rings and ice cores, from the Northern Hemisphere (NH). Little pre-historical temperature data from tropical regions like the IPWP has been incorporated into these analyses, and the global extent of warm temperatures during this interval is unclear. As a result, conclusions regarding past global temperatures still have some uncertainties.

Oppo comments, “Although there are significant uncertainties with our own reconstruction, our work raises the idea that perhaps even the Northern Hemisphere temperature reconstructions need to be looked at more closely.”

Comparisons

The marine-based IPWP temperature reconstruction is in many ways similar to land temperature reconstructions from the Northern Hemisphere (NH). Major trends observed in NH temperature reconstructions, including the cooling during the Little Ice Age (~1500-1850 AD) and the marked warming during the late twentieth century, are also observed in the IPWP.

“The more interesting and potentially controversial result is that our data indicate surface water temperatures during a part of the Medieval Warm Period that are similar to today’s,” says Oppo. NH temperature reconstructions also suggest that temperatures warmed during this time period between A.D. 1000 and A.D. 1250, but they were not as warm as modern temperatures. Oppo emphasizes, “Our results for this time period are really in stark contrast to the Northern Hemisphere reconstructions.”

Reconstructing Historical Temperatures

Records of water temperature from instruments like thermometers are only available back to the 1850s. In order to reconstruct temperatures over the last 2,000 years, Oppo and her colleagues used a proxy for temperature collected from the skeletons of marine plankton in sediments in the Indo-Pacific Ocean. The ratio of magnesium to calcium in the hard outer shells of the planktonic foraminifera Globigerinoides ruber varies depending on the surface temperature of the water in which it grows. When the phytoplankton dies, it falls to the bottom of the ocean and accumulates in sediments, recording the sea surface temperature in which it lived.

“Marine sediments accumulate slowly in general -- approximately 3 cm/yr -- which makes it hard to overlap sediment record with instrumental record and compare that record to modern temperature records," says Oppo. "That’s what is different about this study. The sediment accumulates fast enough in this region to give us enough material to sample and date to modern times.”

The team generated a composite 2000-year record by combining published data from a piston core in the area with the data they collected using a gravity corer and a multi-corer. Tubes on the bottom of the multi-corer collected the most recently deposited sediment, therefore enabling the comparison of sea surface temperature information recorded in the plankton shells to direct measurements from thermometers.

Oppo cautions that the reconstruction contains some uncertainties. Information from three different cores was compiled in order to reconstruct a 2,000-year-long record. In addition sediment data have an inherent uncertainty associated with accurately dating samples. The SST variations they have reconstructed are very small, near the limit of the Mg/Ca dating method. Even in light of these issues, the results from the reconstruction are of fundamental importance to the scientific community.

More Questions to Answer

The overall similarity in trend between the Northern Hemisphere and the IPWP reconstructions suggests that that Indonesian SST is well correlated to global SST and air temperature. On the other hand, the finding that IPWP SSTs seem to have been approximately the same as today in the past, at a time when average Northern Hemisphere temperature appear to have been cooler than today, suggests changes in the coupling between IPWP and Northern Hemisphere or global temperatures have occurred in the past, for reasons that are not yet understood. “This work points in the direction of questions that we have to ask,” Oppo says. “This is only the first word, not the last word.”

The US National Science Foundation and the WHOI Ocean and Climate Change Institute provided funding for this work.


__________________
The Woods Hole Oceanographic Institution is a private, independent organization in Falmouth, Mass., dedicated to marine research, engineering, and higher education. Established in 1930 on a recommendation from the National Academy of Sciences, its primary mission is to understand the oceans and their interaction with the Earth as a whole, and to communicate a basic understanding of the oceans’ role in the changing global environment.

Last updated: September 2, 2009
 
Megavolcano


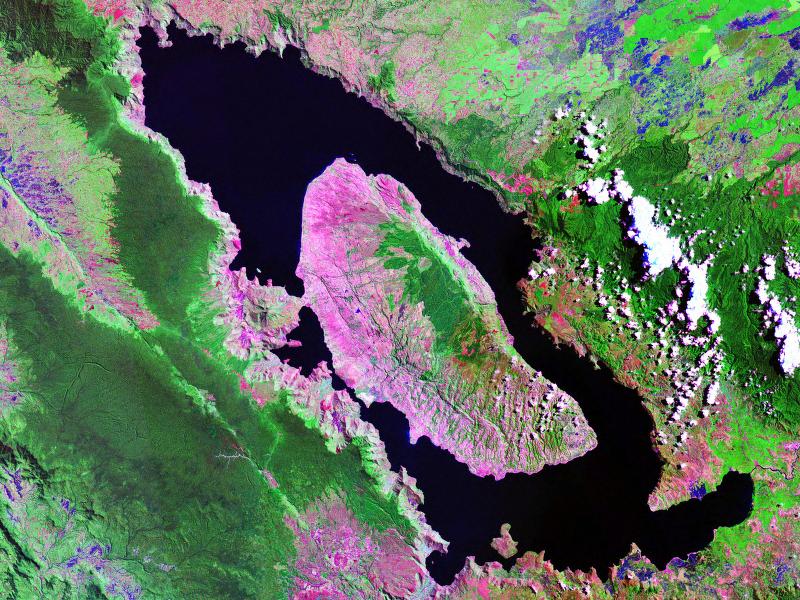
On the Indonesian island of Sumatra lies the remnant crater lake known as Lake Toba. The lake is 62 MILES LONG and 19 MILES WIDE. The megavolcano Toba last erupted ~75,000 years ago
Lake_Toba_location.png
Toba_zoom.jpg
with catastrophic consequences for life on the planet.


http://maps.google.com/maps?hl=en&ie=UTF8&ll=2.558963,98.819275&spn=10.040595,21.049805&t=h&z=7

http://maps.google.com/maps?hl=en&ie=UTF8&ll=2.558963,98.819275&spn=20.004862,42.099609&z=6

http://en.wikipedia.org/wiki/Lake_Toba

Excerpted from the Wikipedia entry:
The Toba eruption (the Toba event) occurred at what is now Lake Toba about 67,500 to 75,500 years ago. It had an estimated Volcanic Explosivity Index of 8 (described as "mega-colossal"), making it possibly the largest explosive volcanic eruption within the last twenty-five million years. It had a volume 300 cubic km greater than the Island Park Caldera supereruption (2500 cubic km) of 2.1 million years BP.

Bill Rose and Craig Chesner of Michigan Technological University have deduced that the total amount of erupted material was about 2,800 km3 (670 cu mi)— around 2,000 km3 (480 cu mi) of ignimbrite that flowed over the ground, and around 800 km3 (190 cu mi) that fell as ash, with the wind blowing most of it to the west. The pyroclastic flows of the eruption destroyed an area of 20,000 square kilometres (7,722 sq mi), with ash deposits as thick as 600 metres (1,969 ft) by the main vent. By contrast, the 1980 eruption of Mount St. Helens ejected around 1.2 km3 (0.29 cu mi) of material, whilst the largest volcanic eruption in historic times, at Mount Tambora in 1815, emitted the equivalent of around 100 km3 (24 cu mi) of dense rock and created the "Year Without a Summer" as far away as North America. The eruption was also about three times the size of the latest Yellowstone eruption of Lava Creek 630,000 years ago...

...The eruption lasted perhaps two weeks, but the ensuing "volcanic winter" resulted in a decrease in average global temperatures by 3 to 3.5 degrees Celsius [ 10+ ° F. !!!! ] for several years. Greenland ice cores record a pulse of starkly reduced levels of organic carbon sequestration. Very few plants or animals in southeast Asia would have survived, and it is possible that the eruption caused a planet-wide die-off. There is some evidence, based on mitochondrial DNA, that the human race may have passed through a genetic bottleneck around this time, reducing genetic diversity below what would be expected from the age of the species. According to the Toba catastrophe theory proposed by Stanley H. Ambrose of the University of Illinois at Urbana-Champaign in 1998, human populations may have been reduced to only a few tens of thousands of individuals by the Toba eruption.
 
http://www.media.rice.edu/media/NewsBot.asp?MODE=VIEW&ID=12794&SnID=1419357327

7/14/2009


CONTACT: Jade Boyd
PHONE: 713-348-6778
E-MAIL: jadeboyd@rice.edu

Global warming: Our best guess is likely wrong
Unknown processes account for much of warming in ancient hot spell

No one knows exactly how much Earth's climate will warm due to carbon emissions, but a new study this week suggests scientists' best predictions about global warming might be incorrect.

The study, which appears in Nature Geoscience, found that climate models explain only about half of the heating that occurred during a well-documented period of rapid global warming in Earth's ancient past. The study, which was published online today, contains an analysis of published records from a period of rapid climatic warming about 55 million years ago known as the Palaeocene-Eocene thermal maximum, or PETM.

"In a nutshell, theoretical models cannot explain what we observe in the geological record," said oceanographer Gerald Dickens, a co-author of the study and professor of Earth science at Rice University. "There appears to be something fundamentally wrong with the way temperature and carbon are linked in climate models."

During the PETM, for reasons that are still unknown, the amount of carbon in Earth's atmosphere rose rapidly. For this reason, the PETM, which has been identified in hundreds of sediment core samples worldwide, is probably the best ancient climate analogue for present-day Earth.

In addition to rapidly rising levels of atmospheric carbon, global surface temperatures rose dramatically during the PETM. Average temperatures worldwide rose by about 7 degrees Celsius -- about 13 degrees Fahrenheit -- in the relatively short geological span of about 10,000 years.

Many of the findings come from studies of core samples drilled from the deep seafloor over the past two decades. When oceanographers study these samples, they can see changes in the carbon cycle during the PETM.

"You go along a core and everything's the same, the same, the same, and then suddenly you pass this time line and the carbon chemistry is completely different," Dickens said. "This has been documented time and again at sites all over the world."

Based on findings related to oceanic acidity levels during the PETM and on calculations about the cycling of carbon among the oceans, air, plants and soil, Dickens and co-authors Richard Zeebe of the University of Hawaii and James Zachos of the University of California-Santa Cruz determined that the level of carbon dioxide in the atmosphere increased by about 70 percent during the PETM.

That's significant because it does not represent a doubling of atmospheric carbon dioxide. Since the start of the industrial revolution, carbon dioxide levels are believed to have risen by about one-third, largely due to the burning of fossil fuels. If present rates of fossil-fuel consumption continue, the doubling of carbon dioxide from fossil fuels will occur sometime within the next century or two.

Doubling of atmospheric carbon dioxide is an oft-talked-about threshold, and today's climate models include accepted values for the climate's sensitivity to doubling. Using these accepted values and the PETM carbon data, the researchers found that the models could only explain about half of the warming that Earth experienced 55 million years ago.

The conclusion, Dickens said, is that something other than carbon dioxide caused much of the heating during the PETM. "Some feedback loop or other processes that aren't accounted for in these models -- the same ones used by the IPCC for current best estimates of 21st Century warming -- caused a substantial portion of the warming that occurred during the PETM."
 
Did anyone catch the "Freedom of information" release of Treasury studies yesterday? If Cap & Tax is passed everyone gets to pny up $1761.00 a year in enrgy taxes. So much for the Liar in Chiefs promise not to tax the middle class.
 
http://scienceandpublicpolicy.org/images/stories/papers/originals/Nova-Exile_for_non_believers.pdf

An excerpt:
Sep 24, 2009
Exile for Non-Believers
By Joanne Nova

The price for speaking out against global warming is exile from your peers, even if you are at the top of your field. What follows is an example of a scientific group that not only stopped a leading researcher from attending a meeting, but then - without discussing the evidence - applauds the IPCC and recommends urgent policies to reduce greenhouse gases. What has science been reduced to if bear biologists feel they can effectively issue ad hoc recommendations on worldwide energy use? How low have standards sunk if informed opinion is censored, while uninformed opinion is elevated to official policy?

If a leading researcher can’t speak his mind without punishment by exile, what chance would any up-and-coming researcher have? As Mitchell Taylor points out “It’s a good way to maintain consensus”. And so it is. But it’s not science. Mitchell Taylor is a Polar Bear researcher who has caught more polar bears and worked on more polar bear groups than any other, but he was effectively ostracized from the Polar Bear Specialist Group (PBSG) specifically because he has publicly expressed doubts that there is a crisis due to carbon dioxide emissions.

Dr. Andy Derocher, the outgoing chairman of the PSBG and Professor at the University of Alberta, wrote to inform Taylor that he was not welcome at the 2009 meeting of the PBSG. Keep in mind as you read his comments (below) that Taylor had arranged funding to attend the meeting in Copenhagen, and has been at every meeting of this group since 1981. With 30 years of experience in polar bear research, it goes without saying that he has something to contribute to any discussion about polar bear conservation...


Demographic and Ecological Perspectives on the Status of Polar Bears
Dr. Mitchell Taylor and Dr. Martha Dowsley
Abstract

Although two polar bear subpopulations (Western Hudson Bay and Southern Beaufort Sea) no longer appear to be viable due to reduction in sea ice habitat, polar bears as a species do not appear to be threatened by extinction in the foreseeable future from either a demographic or an ecological perspective. Ecological perspectives that suggest the reductions to survival and recruitment rates for two populations (Western Hudson Bay and Southern Beaufort Sea) have occurred because of a long-term decline in sea ice due to climate warming. These populations occur where summer ice coverage is seasonal (WH) or divergent (SB). The perspective that the impacts of sea ice reductions experienced in WH and SB subpopulations can be generalized to the remainder of the polar bear subpopulations depends entirely on the IPCC GCMs that predict continued reductions to sea ice due to CO2 driven climate change. Current and historical polar bear subpopulation performance demonstrates that viable polar bear subpopulations have persisted and generally increased throughout the current period of climate warming. The mean generation time of polar bears as defined by the IUCN/SSC Redbook criteria and the Committee on the Status of Endangered Wildlife in Canada (COSEWIC) is 12 not 15 years. The time-frame for three generations for polar bears is 36 not 45 years as indicated by the IUCN/SSC Polar Bear Specialists Group. Based on the assumption of a linear relationship of population numbers to sea ice habitat, extrapolation of IPCC GCM sea ice predictions over a thirty-six year interval does not support the contention that polar bears are threatened with extinction over the next three generations. Extrapolation of IPCC GCM sea ice predictions over a hundred year interval does not support the contention that polar bears are threatened with extinction in the foreseeable future. Population viability analyses (PVA), using demographic estimates from polar bear populations where the data are sufficient, indicate that population status is affected by both anthropogenic removals and vital rates. PVAs that employ current demographic and removal rates indicate that most polar bear populations could sustain the current removal rate indefinitely. Management action for populations where removal rates exceed the estimated sustainable levels has occurred and is ongoing.

The popular notion that polar bears are declining or already expatriated worldwide has been initiated and perpetuated by environmental organizations and individuals who apparently believe that current subpopulation numbers and trends are an insufficient basis for an appropriate status determination. These individuals and organizations suggest that an ecological consideration constitutes more appropriate methodology to assess status of polar bears and presumably all species. Observations of natural mortality, intra-specific aggression, poor condition, and even healthy bears in good condition on ice floes have been cited as evidence of a population impacts on polar bears due to declining sea ice. Anecdotal information, although useful and interesting, is not equivalent to scientific information based on valid statistical analysis of sample data. Simultaneously, traditional ecological knowledge (TEK) from Inuit has been largely ignored because TEK is mostly oral, and because TEK generally does not support the assertion that polar bear populations are in general, or even local decline.
http://scienceandpublicpolicy.org/images/stories/papers/reprint/taylor_polar_bears.pdf

"There aren't just a few more bears. There are a ... lot more bears," biologist Mitchell Taylor told the Nunatsiaq News of Iqaluit in the Arctic territory of Nunavut... Dr. Taylor explained his conviction that threats to polar bears from global warming are exaggerated and that their numbers are increasing. He has studied the animals for the Nunavut government for two decades...

...Inuit hunters make their own estimates of the polar bear population based on the number of animals they encounter on their travels. Taylor says scientists have ignored the anecdotal evidence of the Inuit, who say bear numbers were rising. Inuits also report more polar bears wandering into their towns and villages, where they are a threat to children.

"I'm pretty sure the numbers [of polar bears] are climbing," says Pitselak Pudlat, an Inuit hunter and manager of the Aiviq Hunters and Trappers Organization at Cape Dorset, Baffin Island. "During the winter there were polar bears coming into town." His community is north of the bear population studied by Taylor...
http://www.csmonitor.com/2007/0503/p13s01-wogi.html?page=1


[ Letterhead ]
Dr. Mitchell Taylor
Polar Bear Biologist,
Department of the Environment,
Government of Nunavut , Igloolik , Nunavut , Canada

May 1, 2006


_____________________________________________________


Tim Flannery is one of Australia 's best-known scientists and authors. That doesn't mean what he says is correct or accurate. That was clearly demonstrated when he recently ventured into the subject of climate change and polar bears. Climate change is threatening to drive polar bears into extinction within 25 years, according to Flannery. That is a startling conclusion and certainly is a surprising revelation to the polar bear researchers who work here and to the people who live here. We really had no idea.

The evidence for climate change effects on polar bears described by Flannery is incorrect. He says polar bears typically gave birth to triplets, but now they usually have just one cub. That is wrong.

All research and traditional knowledge shows that triplets, though they do occur, are very infrequent and are by no means typical. Polar bears generally have two cubs — sometimes three and sometimes one. He says the bears' weaning time has risen to 18 months from 12. That is wrong. The weaning period has not changed. Polar bears worldwide have a three-year reproduction cycle, except for one part of Hudson Bay for a period in the mid-1980s when the cycle was shorter.

One polar bear population (western Hudson Bay ) has declined since the 1980s and the reproductive success of females in that area seems to have decreased. We are not certain why, but it appears that ecological conditions in the mid-1980s were exceptionally good.

Climate change is having an effect on the west Hudson population of polar bears, but really, there is no need to panic. Of the 13 populations of polar bears in Canada , 11 are stable or increasing in number. They are not going extinct, or even appear to be affected at present.

It is noteworthy that the neighbouring population of southern Hudson Bay does not appear to have declined, and another southern population ( Davis Strait ) may actually be over-abundant.

I understand that people who do not live in the north generally have difficulty grasping the concept of too many polar bears in an area. People who live here have a pretty good grasp of what that is like to have too many polar bears around.

This complexity is why so many people find the truth less entertaining than a good story. It is entirely appropriate to be concerned about climate change, but it is just silly to predict the demise of polar bears in 25 years based on media-assisted hysteria.

Dr. Mitchell Taylor

http://meteo.lcd.lu/globalwarming/Taylor/last_stand_of_our_wild_polar_bears.html


Last edited:
By: Steve McIntyre, Climate Audit

The next graphic compares the RCS chronologies from the two slightly different data sets: red – the RCS chronology calculated from the CRU archive (with the 12 picked cores); black – the RCS chronology calculated using the Schweingruber Yamal sample of living trees instead of the 12 picked trees used in the CRU archive. The difference is breathtaking.

rcs_chronologies_rev2.gif

Figure 2. A comparison of Yamal RCS chronologies. red – as archived with 12 picked cores; black – including Schweingruber’s Khadyta River, Yamal (russ035w) archive and excluding 12 picked cores. Both smoothed with 21-year gaussian smooth. y-axis is in dimensionless chronology units centered on 1 (as are subsequent graphs (but represent age-adjusted ring width).


Here is a comparison of the Briffa chronology of the spaghetti graphs (red) versus the “SChweingruber” variation i.e. using russ035w instead of 12 recent of 252 CRU cores, leaving 240 unchanged. (The red curve here is the archived CRU chronology, which varies slightly from my emulation of the RCS chronology.)
rcs_merged_recent1.gif


count_comparison1.gif

rcs_chronologies_rev2.gif

rcs_merged_rev2.gif


By: Ross McKitrick
1. In a 1995 Nature paper by Briffa, Schweingruber et al., they reported that 1032 was the coldest year of the millennium – right in the middle of the Medieval Warm Period. But the reconstruction depended on 3 short tree ring cores from the Polar Urals whose dating was very problematic. http://www.climateaudit.org/?p=877.

2. In the 1990s, Schweingruber obtained new Polar Urals data with more securely-dated cores for the MWP. Neither Briffa nor Schweingruber published a new Polar Urals chronology using this data. An updated chronology with this data would have yielded a very different picture, namely a warm medieval era and no anomalous 20th century. Rather than using the updated Polar Urals series, Briffa calculated a new chronology from Yamal – one which had an enormous hockey stick shape. After its publication, in virtually every study, Hockey Team members dropped Polar Urals altogether and substituted Briffa’s Yamal series in its place.
http://www.climateaudit.org/?p=528. PS: The exception to this pattern was Esper et al (Science) 2002, which used the combined Polar Urals data. But Esper refused to provide his data. Steve got it in 2006 after extensive quasi-litigation with Science (over 30 email requests and demands).

3. Subsequently, countless studies appeared from the Team that not only used the Yamal data in place of the Polar Urals, but where Yamal had a critical impact on the relative ranking of the 20th century versus the medieval era.
http://www.climateaudit.org/?p=3099

4. Meanwhile Briffa repeatedly refused to release the Yamal measurement data used inhis calculation despite multiple uses of this series at journals that claimed to require data archiving. E.g. http://www.climateaudit.org/?p=542

5. Then one day Briffa et al. published a paper in 2008 using the Yamal series, again without archiving it. However they published in a Phil Tran Royal Soc journal which has strict data sharing rules. Steve got on the case. http://www.climateaudit.org/?p=3266

6. A short time ago, with the help of the journal editors, the data was pried loose and appeared at the CRU web site. http://www.climateaudit.org/?p=7142

7. It turns out that the late 20th century in the Yamal series has only 10 tree ring chronologies after 1990 (5 after 1995), making it too thin a sample to use (according to conventional rules). But the real problem wasn’t that there were only 5-10 late 20th century cores- there must have been a lot more. They were only using a subset of 10 cores as of 1990, but there was no reason to use a small subset. (Had these been randomly selected, this would be a thin sample, but perhaps passable. But it appears that they weren’t randomly selected.)
http://www.climateaudit.org/?p=7142

8. Faced with a sample in the Taymir chronology that likely had 3-4 times as many series as the Yamal chronology, Briffa added in data from other researchers’ samples taken at the Avam site, some 400 km away. He also used data from the Schweingruber sampling program circa 1990, also taken about 400 km from Taymir. Regardless of the merits or otherwise of pooling samples from such disparate locations, this establishes a precedent where Briffa added a Schweingruber site to provide additional samples. This, incidentally, ramped up the hockey-stickness of the (now Avam-) Taymir chronology.
http://www.climateaudit.org/?p=7158

9. Steve thus looked for data from other samples at or near the Yamal site that could have been used to increase the sample size in the Briffa Yamal chronology. He quickly discovered a large set of 34 Schweingruber samples from living trees. Using these instead of the 12 trees in the Briffa (CRU) group that extend to the present yields Figure 2, showing a complete divergence in the 20th century. Thus the Schweingruber data completely contradicts the CRU series. Bear in mind the close collaboration of Schweingruber and Briffa all this time, and their habit of using one another’s data as needed.

10. Combining the CRU and Schweingruber data yields the green line in the 3rd figure above. While it doesn’t go down at the end, neither does it go up, and it yields a medieval era warmer than the present, on the standard interpretation. Thus the key ingredient in a lot of the studies that have been invoked to support the Hockey Stick, namely the Briffa Yamal series (red line above) depends on the influence of a thin subsample of post-1990 chronologies and the exclusion of the (much larger) collection of readily-available Schweingruber data for the same area.


yamal-eps.jpg
 
Last edited:


I'll be goddamned! The frickin' Beeb!


What happened to global warming?
By Paul Hudson
Climate correspondent, BBC News

Average temperatures have not increased for over a decade
This headline may come as a bit of a surprise, so too might that fact that the warmest year recorded globally was not in 2008 or 2007, but in 1998.

But it is true. For the last 11 years we have not observed any increase in global temperatures.

And our climate models did not forecast it, even though man-made carbon dioxide, the gas thought to be responsible for warming our planet, has continued to rise.

So what on Earth is going on? ...

*****

Full article: http://news.bbc.co.uk/2/hi/science/nature/8299079.stm


Back
Top