The Nobel Prize (for propaganda)

http://www.washingtonpost.com/wp-dyn/content/article/2010/04/05/AR2010040503722_pf.html

Scientists' use of computer models to predict climate change is under attack
By David A. Fahrenthold
Washington Post Staff Writer
Tuesday, April 6, 2010; HE01


These and other models are only as smart as the scientists who build them -- they rely on data that scientists have gathered about the real world, and the accuracy of estimates about how all the factors fit together (Is an experienced coach more or less important than young defensive backs?).

They also depend on the computers running them. To accurately depict how individual clouds form and disappear, for instance, the computers that model climate change would need to be a million times faster. For now, the effects of clouds have to be estimated.

But scientists say complexity doesn't guarantee accuracy. The best test of a model is to check it against reality.

"We're never going to perfectly model reality. We would need a system as complicated as the world around us," said Ken Fleischmann, a professor of information studies at the University of Maryland. He said scientists needed to make the uncertainties inherent in models clear: "You let people know: It's a model. It's not reality. We haven't invented a crystal ball."

*****​

"It's an educated, scientifically based guess," said Michael Winton, an oceanographer at the National Oceanic and Atmospheric Administration. "But it's a guess nonetheless."

But Warren Meyer, a mechanical and aerospace engineer by training who blogs at www.climate-skeptic.com, said that climate models are highly flawed. He said the scientists who build them don't know enough about solar cycles, ocean temperatures and other things that can nudge the earth's temperature up or down. He said that because models produce results that sound impressively exact, they can give off an air of infallibility.

But, Meyer said -- if the model isn't built correctly -- its results can be both precise-sounding and wrong.

"The hubris that can be associated with a model is amazing, because suddenly you take this sketchy understanding of a process, and you embody it in a model," and it appears more trustworthy, Meyer said. "It's almost like money laundering."

*****​
 
http://www.amstat-online.org/sections/envr/ssenews/ENVR_9_1.pdf


The role of statisticians in public policy debates over climate change

Richard L. Smith
Department of Statistics and
Operations Research
University of North Carolina


The past year has been a busy one for statisticians interested in climate change. In February this year, the Intergovernmental Panel on Climate Change (IPCC) issued the Summary for Policymakers of its Fourth Assessment Report, which included IPCC's strongest statement yet about human influence being “very likely” a direct cause of observed global warming. The U.S. government's Climate Change Science Program (CCSP) is in the midst of producing 21 “special assessment reports” on different aspects of climate change as it applies to North America. And in 2006, several statisticians were involved in a well-publicized controversy over the so-called “hockey-stick curve”. This controversy was the central feature of a late-breaking session entitled “What is the Role of Statistics in Public Policy Debates about Climate Change?” that was organized jointly by Edward Wegman (George Mason University) and myself at the 2006 Joint Statistical Meetings. The session took place in front of a standing-room-only audience and was chaired by Doug Nychka (National Center for Atmospheric Research).

The three speakers were Ed Wegman, J. Michael Wallace of the Department of Atmospheric Sciences, University of Washington, and myself. Ed and Mike both talked about the hockey stick reconstruction. Ed focused on statistical flaws that, in his view, render much of the current literature on this subject of doubtful validity.

*****​
 
Nitrous Oxide’s Global Warming Impact No Laughing Matter

Thawing permafrost in the Northern Hemisphere releases “large amounts” of greenhouse gas nitrous oxide, according to a new study from the journal Nature Geoscience.

The study found that under certain conditions thawed permafrost can release as much nitrous oxide as tropical forests, one of the main sources of the gas.

Nitrous oxide, also known as “laughing gas,” is ranked third behind carbon dioxide and methane in contributing to global warming, and is regulated under the Kyoto Protocols. According to the EPA, the gas is 310 times more effective in trapping heat than carbon dioxide. Sixty percent of the nitrous in the atmosphere is produced naturally.

Global warming “wild card”

Twenty-five percent of the land surface in the Northern Hemisphere is underlain by permafrost, and as it thaws it could create a feedback loop that accelerates global warming, because it releases greenhouse gases, like methane and carbon dioxide, which in turn increase warming, spurring more thawing.

Scientists had thought only a little nitrous oxide was released during this process, but the journal study suggests otherwise.

Scientist Bo Elberling led the study, which was conducted on permafrost core samples from Greenland. Thawing and draining the soil from the cores did not increase the production of nitrous oxide, but when the scientists re-saturated the samples with meltwater from the frozen soil — as would happen naturally after thawing — nitrous oxide production was increased 20 times, with a third of it entering the atmosphere.

http://www.triplepundit.com/2010/04/nitrous-oxides-global-warming-impact-no-laughing-matter/
 
"We're never going to perfectly model reality. We would need a system as complicated as the world around us," said Ken Fleischmann, a professor of information studies at the University of Maryland. He said scientists needed to make the uncertainties inherent in models clear: "You let people know: It's a model. It's not reality. We haven't invented a crystal ball."

trysail, aren't you the one who tried to pass off a climate model program of about one hundred thousand lines as having about forty? And why don't you give us a list of all those scientists using computer modeling who confuse a software program with reality? Having looked for the latest issue of The Journal of Scientific Crystal Ball Prognostication and Alchemy, I couldn't find it at my local university's Library of Dumbledorian Arts and Sciences.

Pity...I was looking forward to reading the article on Curing Warts By Pasting Drivel: A Holistic Approach, which may or may not have been written by trysail The Magnificent, Slayer of Dragons, Mountain Trolls and General All Round Master of the Puke Green Over Sized Font. Not you certainly but your evil twin brother, perhaps.

But Warren Meyer, a mechanical and aerospace engineer by training who blogs at www.climate-skeptic.com, said that climate models are highly flawed.

He certainly ought to know.
 

Caspar and the Jesus paper


A. W. Montford
Aug 11, 2008
http://bishophill.squarespace.com/blog/2008/8/11/caspar-and-the-jesus-paper.html

There has been the most extraordinary series of postings at Climate Audit over the last week. As is usual at CA, there is a heavy mathematics burden for the casual reader, which, with a bit of research I think I can now just about follow. The story is a remarkable indictment of the corruption and cyncism that is rife among climate scientists, and I'm going to try to tell it in layman's language so that the average blog reader can understand it. As far as I know it's the first time the whole story has been set out in a single posting. It's a long tale - and the longest posting I think I've ever written and piecing it together from the individual CA postings has been a long, hard but fascinating struggle. You may want to get a long drink before starting, and those who suffer from heart disorders may wish to take their beta blockers first.


At some time or another, most people will have seen the hockey stick - the iconic graph which purports to show that after centuries of stable temperatures, the second half of the twentieth century saw a sudden and unprecedented warming of the globe. This was caused, we were told, by mankind burning fossil fuels and releasing carbon dioxide into the atmosphere. For a while, the hockey stick was everywhere - unimpeachable evidence that mankind was damaging the planet - an impact that would require drastic measures to reverse. The stick's most famous outing however was just a couple of years ago when it made a headlining appearance in Al Gore's drama-documentary, An Inconvenient Truth. The revelation of the long, thin graph with its dramatic temperature rise in the last few decades, and the audience gasps that accompanied it, is something of a key moment for many environmentalists.

Shortly after its publication, the hockey stick and its main author, Michael Mann, came under attack from Steve McIntyre, a retired statistician from Canada. In a series of scientific papers and later on his blog, Climate Audit, McIntyre took issue with the novel statistical procedures used by the hockey stick's authors. He was able to demonstrate that the way they had extracted the temperature signal from the tree ring records was biased so as to choose hockey-stick shaped graphs in preference to other shapes, and criticised Mann for not publishing the cross validation R2, a statistical measure of how well the temperature reconstruction correlated with actual temperature records. He also showed that the appearance of the graph was due solely to the use of an estimate of historic temperatures based on tree rings from bristlecone pines, a species that was known to be problematic for this kind of reconstruction.


The controversy raged for several years, involving blue riband panels, innumerable blog postings, endless name-calling and dark insinuations about motivations and conflicts of interest. In May 2005, at the height of the controversy, and on the very day that McIntyre was making a rare public appearance in Washington to discuss his findings, two Mann associates, Caspar Amman and Eugene Wahl, issued a press release in which they claimed that they had submitted two manuscripts for publication, which together showed that they had replicated the hockey stick exactly, confirmed its statistical underpinnings and demonstrated that McIntyre's criticisms were baseless. This was trumpeted as independent confirmation of the hockey stick. A few eyebrows were raised at the dubious practice of using a press release to announce scientific findings. Some also noted that on the rare occasions that this kind of announcement is made, it tends to be about papers that have been published, or at least accepted for publication. To make such a dramatic announcement about the submission of a paper was unusual in the extreme.

The first of these papers ("the GRL paper") was submitted to Geophysical Research Letters, the journal of the American Geophysical Union. It took the form of a rebuttal of a McIntyre paper that had attacked the hockey stick and had been published in the same journal. From the first, the McIntyre paper had been controversial. Apart from Amman and Wahl's paper, there were three other papers taking issue with it. However, it turned out that some of these attempted rebuttals were less well formed than others. In fairly short order, Amman and Wahl's paper was rejected, many of its criticisms either relating to other McIntyre papers than the one at hand, or relying on the second paper for their arguments. Since the second paper was unpublished, it was effectively impossible for McIntyre to defend himself against these criticisms. Shortly after Amman and Wahl's paper was rejected, another of the rebuttals, that of a physicist called David Ritson, was also shot down by the journal's editors.


Meanwhile the second, longer paper ("the CC paper") had started its long road to publication at the journal Climatic Change. This article purported to be a replication of the hockey stick and confirmation of its scientific correctness. However, in a surprising turn of events, the journal's editor, prominent global warming catastrophist Steven Schneider, mischievously asked none other than Steve McIntyre to be one of the paper's anonymous peer reviewers.

We have seen above that one of the chief criticisms of the hockey stick was the fact that its author, Michael Mann, had withheld the validation statistics so that it was impossible for anyone to gauge the reliability of the reconstruction. These validation statistics were to be key to the subsequent story. At the time of their press release Wahl and Amman had made public the computer code that they'd used in their papers. By the time their paper was submitted to Climatic Change, McIntyre had reconciled their work with his own so that he understood every difference. And he therefore now knew that Wahl and Amman's work suffered from exactly the same problem as the hockey stick itself: the R2 number was so low as to suggest that the hockey stick had no meaning at all, although another statistic, the reduction of error statistic (or RE) was relatively high. It was only this latter figure that had been mentioned in the paper. In other words, far from confirming the scientific integrity of the hockey stick, Wahl and Amman's work confirmed McIntyre's criticisms of it! McIntyre's first action as a peer reviewer was therefore to request from Wahl and Amman the verification statistics for their replication of the stick. Confirmation that the R2 was close to zero would strike a serious blow at Wahl and Amman's work.


Wahl and Amman's response was to refuse any access to the verification numbers, a clear flouting of the journal's rules. As a justification of this extraordinary action, they claimed that they had shown that McIntyre's criticisms had been rebutted in their forthcoming GRL paper, despite the fact that the paper had been rejected by the journal some days earlier. At the start of July, with his review of the CC paper complete, McIntyre took the opportunity to probe this point, by asking the journal to find out the anticipated publication date of the GRL paper. Wahl and Amman were forced to admit the rejection, but they declared that it was unjustified and that they would seek publication elsewhere.


With the replication of the hockey stick in tatters, reasonable people might have expected some sort of pause in the political momentum. Seasoned observers of the climate scene, however, will be unsurprised to hear that global warming eminences grises like Sir John Houghton and Michael Mann continued to cite the Wahl and Amman papers despite the CC paper being in publishing limbo and the GRL paper being apparently dead and buried. The Wahl and Amman press release was not withdrawn either.


Events soon took another surprising turn., It was announced that the editor in chief of Geophysical Research Letters, Jay Famiglietti, had taken over the file for the McIntyre paper and its responses. This was justified he claimed, because of the high number of responses - four - that the McIntyre paper had received. That two of those responses had been rejected and were no longer in play was not mentioned. The reason for the change quickly became apparent though when, at the end of September, the rejected response from David Ritson turned out not only to have been re-submitted but had also been accepted for publication. This was another clear breach of the journal's rules, which required that an article's author should be able to comment on responses before they were accepted. Famiglietti however refused to make any on-the-record comments about why he behaved as he did.


If McIntyre had any suspicions about the implications of Famiglietti's malfeasance, he must have been quite certain when, shortly afterwards, hockey stick author Michael Mann commented on his RealClimate blog that both the CC and the GRL papers were going to be accepted shortly. Sure enough, in the last week of September, the GRL paper was resubmitted and revisions were made to the CC paper. Both papers were back in play again.


As 2005 neared its end, two important events loomed large. The first was the year end deadline for submission of papers for the IPCC's Fourth Assessment Report on the state of the climate, and realisation soon dawned on McIntyre and the observers of the goings-on at GRL:

the IPCC needed to have the Wahl and Amman papers in the report so that they could continue to use the hockey stick, with its frightening and unprecedented uptick in temperatures. Mountains were going to be moved to keep the papers in play.


The other important happening was the fall meeting of the American Geophysical Union, which would be attended by many of the big names in paleoclimate and at which both McIntyre and Amman would be making presentations. McIntyre's plan was to use the question and answer session after Amman's presentation to once again press for the R2 number for the hockey stick, a figure that had never been released, despite it being constantly requested over the previous years by McIntyre, journals, politicians and journalists. Sure enough, when confronted, Amman once again prevaricated.


After the session, McIntyre attempted to clear the air by inviting Amman to lunch. In the circumstances, this seems to have been a relatively amicable affair, but McIntyre's suggestion that he and Amman write a joint paper outlining where they agreed and where they differed was not taken up. When McIntyre later formalised this offer in an email, Amman failed even to acknowledge it.


While the AGU was meeting in San Francisco, Climate Change had provisionally accepted Wahl and Amman's CC paper, any objections which might have been raised by McIntyre swept aside by simple means of not inviting him to review the second draft. The resubmitted version of the paper turned out to be almost identical to the old one, except that a new section on the statistical treaments had been added, presumably as a condition of acceptance. And here there was an upside because, buried deep within the paper, Amman and Wahl had quietly revealed their verification R2 figures, which were, just as McIntyre had predicted, close to zero for most of the reconstruction, strongly suggesting that the hockey stick had little predictive power. Their decision to reveal these key data is necessarily obscure, but may well have been prompted by McIntyre's decision to file a complaint of academic misconduct about Amman with his employers, UCAR. Although the complaint was rejected, it may well have put sufficient pressure on Amman and the journal to show the numbers that everyone wanted to see.


The CC paper's provision acceptance date was December 12th, just a few days before the AR4 deadline. Strangely the version that was accepted seems to have been dated 24th Feb 2006, so according to its rules the IPCC shouldn't have been able to considered it. And what is more, it appears that the new sections discussing the statistical verifications were only added in this post year-end version. As McIntyre put it:


So under its own rules, is IPCC allowed to refer to Ammann and Wahl [2006]? Of course not. Will they? We all know the answer to that. When they refer to Ammann and Wahl [2006], will they also refer to its confirmation of our claims about MBH verification r2 statistics. Of course not. That information was not available to them in December. But wait a minute, if Ammann and Wahl was in press in December, wouldn’t that information have been available to them? Silly me.​
In other words, the version of the paper which had gone forward to the IPCC didn't include the adverse verification statistics, but the version accepted by the journal did. The IPCC got their rebuttal of McIntyre and the journal got a fig leaf of respectability to cover up its duplicity.


By March, the CC paper had been fully accepted, but there was to be another hiccup that would threaten its existence. After all the shenanigans at GRL with the replacement of the editor and the resubmission of letters, the journal decided once again to reject Wahl and Amman's attempt to rebut McIntyre's work. Ostensibly this was because the arguments were "already out there", but the truth was surely that there were so many holes in the statistical arguments as to make their publishing an embarrassment to the journal.


This new rejection was a problem for the CC paper, as I will explain below. When using an R2 verification, researchers can refer to tables of benchmarks to gauge the significance of their results. Now that the fact that the hockey stick and Amman and Wahl's replication of it were public, Amman was arguing that the correct measure of significance was in fact the alternative RE statistic. His problem was that for RE statistics, there are no tables of benchmarks for the researcher to refer to - he has to establish a benchmark of his own by other means. And Amman had done this in the GRL paper which had just been rejected. Without the GRL paper, he couldn't even argue that his results in CC were statistically significant.

There is a rule of thumb for RE statistics: this says that positive RE numbers have some significance while negative ones do not. Unfortunately for Amman, this rule applies only to linear regressions; as the hockey stick was clearly not linear, it couldn't apply. The original hockey stick authors had claimed that they had created a benchmark through other means, and that the figure was still zero. Now, while they had been silent on the issue in their original GRL submission, Amman and Wahl announced in their resubmission that they had performed benchmarking calculations and that had confirmed that the significance level for the RE should remain at zero.


However, now that the resubmission had been rejected by GRL, the "establishment" of this benchmark was cancelled out, and the statistical arguments in the CC paper which relied on it could no longer be maintained.


And then silence. A year later, the CC paper was nowhere to be seen, despite having been accepted for publication. It was stuck in a kind of publishing limbo once again. This left the IPCC and Climatic Change with a problem. McIntyre observed:


I’m intrigued as to what the final Wahl and Ammann version will look like. They have an intriguing choice: the inclusion of a reference to this article in AR4 was premised on their article being “in press” which would prohibit them from re-working their article to deal with the GRL rejection. But the article needs to be re-worked since it will look pretty silly to describe their GRL article as “under review” over 18 months after it has been rejected.​


In the background, however, much had been happening. Suddenly in September 2007, and with the IPCC report published, the CC paper suddenly appeared, preceded in the same journal by another paper by the same authors. What had happened was that Wahl and Amman were quietly allowed to rewrite their rejected GRL paper and submit it to Climatic Change instead. All reference to the rejected GRL paper in the CC paper could be replaced by reference to the new paper, (which I will call the Jesus paper, in light of its extraordinary resurrection and for lack of any less confusing name). With identical authorship, and a maze of cross-references between them, the two CC papers were carefully designed to make understanding how their arguments relied on each other as difficult as possible.


The beauty of this approach was that it allowed for retention of the original acceptance date for the CC paper, and hence its inclusion in the IPCC process. It did leave them with the embarrassing problem that a paper that was allegedly accepted in March 2006 relied upon another paper that even the journal itself said was only received until August (and in reality, is was even later than that) Readers should note that this matters because unless the paper was accepted by the journal by the deadline, it should not have been accepted by IPCC for inclusion in the Fourth Assessment Report. But the IPCC needed the CC paper and despite the inconsistency being pointed out to them, the IPCC they waved the objections aside as irrelevant.

The CC paper argument leads from the text, to the appendix and then onto the Jesus paper. At places in the Jesus paper the argument referred back to the CC paper creating a neat, if logically flawed, circular argument. One notable feature of the CC paper and the Jesus paper was that they relegated some of their key argumentation to their Supplementary Information (SI) sections, online appendices to the published papers. In particular, the Jesus paper stated that the statistical discussions and more precisely, the establishment of RE benchmarks could be seen there. To have key arguments in the SI was most unusual and it quickly became apparent why it had been done: the SI was nowhere to be seen. Even the peer reviewers appear not to have had access, and once again, Amman refused McIntyre's request for the data and code. His reply to this request was startling (and remember that Amman is a public servant):


Under such circumstances, why would I even bother answering your questions, isn’t that just lost time?​
Again, everything fell silent. For the next year nothing more was heard of the two papers. McIntyre pressed from his blog for release of the SI and the politicians were able to quietly take advantage of the political space created by the IPCC report. Then, just a few weeks ago, and entirely unannounced, Wahl and Amman's Supplementary Information suddenly appeared on Caspar Amman's website, some three years after that first press release announcing the refutation of McIntyre's work. With it, and a godsend to McIntyre, was the code used to establish the benchmark for the RE statistic. With no more than a few days work, McIntyre was able to establish exactly what had been done.


You will remember that Amman and Wahl had claimed that they had established a benchmark of zero for a 99% significant RE score - that is to say, there is only a 1% chance that you might have got that score by chance. McIntyre had, much earlier, shown that if you ran red noise through the process, you could get RE scores of more than 0.5. (Red noise is best described as a "random walk" - a line which wiggles at random, but is not entirely random like white noise.) To reduce your chance of random error to 1% you actually needed to score 0.54 for RE. How Amman had come up with zero as his benchmark was a mystery.


Now, with the code in front of him, McIntyre could see exactly what Wahl and Amman had done. And what they had done was to calculate almost exactly the same figure as he had! The number they had arrived at was 0.52, just a whisker away from McIntyre's own 0.54, but they had reported to the world that it was sufficient only to score a positive number! Of course, this wasn't picked up by the peer reviewers because, as we've seen, they didn't have access to the Supplementary Information, but the IPCC's purposes had been served - the hockey stick found its way intact into the Fourth Assessment Report, unscathed by skirmishes with inconvenient statistical truths.


However, the figure of 0.52 was insufficient for W&A's purposes. Their problem was that the key component of the hockey stick had a verification RE of 0.48, leaving it tantalisingly just below the calculated benchmark. They needed it to be in the top rank and getting it there was going to be tricky. For each simulation, a thousand runs through the statistical sausage machine were perfomed and the RE number, the correlation with the temperature record, was recorded. Then all the runs were sorted in order of RE value, the best runs having the highest RE and the worst the lowest. W&A needed to show that the hockey stick RE was right up there with the best simulations - in the top one percent. While its RE was high, it wasn't good enough. And it was no good simply removing runs which had a higher score than the hockey stick, since this would not increase its position enough - they would have been reducing the total number of runs as well as the number of runs which were scoring better than the hockey stick. To get the answer they needed, the higher scoring runs had to be made to be lower than the hockey stick, but left in the calculation.

To do this, Wahl and Amman came up with a value which they called a calibration/verification RE ratio. As the name suggests, this was the ratio of the two RE numbers for calibration and verification. This ratio is however, entirely unknown to statistics, or to any other branch of science. But it was not plucked out of the air. The ratio and the threshold value which was set for it by Wahl and Amman was carefully calculated. They argued that any run with a ratio less than 0.75 should be assigned a score of -9999. Since the hockey stick had a score of 0.813, 0.75 was pretty much the highest level you could go to without rejecting the hockey stick itself. However if you set your ratio threshold too low, not enough runs would be rejected and the hockey stick would no longer be "99% significant". Some of the results of this ratio were entirely perverse - it was possible for a run that had scored a reasonably good RE in the calibration (there was a good correlation between it and the actual temperatures) to be thrown out of the final assessment on the grounds that it had done very well in the verification - the correlation with actual temperatures was considered too good!


With this new, and pretty much entirely arbitrary hurdle in place, Wahl and Amman were able to reject several of the runs which stood between the hockey stick and what they saw as its rightful place as the gold standard for climate reconstructions. That the statistical foundations on which they had built this paleoclimate castle were a swamp of misrepresentation, deceit and malfeasance was, to Wahl and Amman, an irrelevance. For political and public consumption, the hockey stick still lived, ready to guide political decision-making for years to come.
 

Dr. Walt Meier ( of the NSIDC ) responds to Willis Eschenbach's "Trust and Mistrust" ( reproduced in its entirety at the bottom ):


I read Willis Eschenbach’s post last week on Trust and Mistrust where he posed several questions and challenged scientists to respond to the same questions. So, below is my take on these questions. There are a couple points I need to make up front. First, I’m speaking for myself only, not as a representative of the National Snow and Ice Data Center or the University of Colorado. Second, I primarily study sea ice; climate science is a big field and I’m hardly a specialist in the technical details of many climate processes. However, I will provide, as best I can, the current thinking of most scientists working in the various aspects of climate science. Except where explicitly called for, I try to provide only scientific evidence and not my beliefs or personal opinions.

Also, I use the term “climate forcing” throughout. I’m sure this is familiar to most readers, but for clarity: a climate forcing is essentially anything that changes the earth’s global radiation budget (the net amount of radiative energy coming into the earth) and thus “forces” the earth’s climate to change.

Preface Question 1: Do you consider yourself an environmentalist?

Yes. However, I’m no tree-hugger. I don’t believe the environment should be preserved at all costs. I love my creature comforts and I don’t think we can or should ask people to significantly “sacrifice” for the environment. My feeling is that the environment has value and this value needs to be considered in economic and political decisions. In other words, the cost of cutting down a tree in a forest isn’t just the labor and equipment but also the intrinsic value of the tree to provide, among other things: (1) shade/scenery/inspiration for someone talking a walk in the woods, (2) a habitat for creatures living in the forest, (3) a sink for CO2, etc. And I don’t doubt at all that Willis is an environmentalist. However, whether one is an environmentalist or not doesn’t make the scientific evidence more or less valid.

Preface Question 2: What single word would you choose to describe your position on climate science?

Skeptic. This may surprise many people. But any good scientist is a skeptic. We always need to challenge accepted wisdom, we need to continually ask “does this make sense?, does it hold up?, is there another explanation?, is there a better explanation?” – not just of the work of other scientists, but also of our own work. However, a good skeptic also recognizes when there is enough evidence to place confidence in a finding. Almost all new theories have initially been looked upon skeptically by scientists of the time before being accepted – gravity, evolution, plate tectonics, relativity, quantum mechanics, etc.

Question 1. Does the earth have a preferred temperature, which is actively maintained by the climate system?

Willis says that he “believes the answer is yes”. In science “belief” doesn’t have much standing beyond initial hypotheses. Scientists need to look for evidence to support or refute any such initial beliefs. So, does the earth have a preferred temperature? Well, there are certainly some self-regulating mechanisms that can keep temperatures reasonably stable at least over a certain range of climate forcings. However, this question doesn’t seem particularly relevant to the issue of climate change and anthropogenic global warming. The relevant question is: can the earth’s temperature change over a range that could significantly impact modern human society? The evidence shows that the answer to this is yes. Over the course of its history the earth has experienced climatic regimes from the “snowball earth” to a climate where ferns grew near the North Pole. Both of those situations occurred tens or hundreds of millions of years ago; but more recently, the earth has experienced several ice age cycles, and just ~12,000 years ago, the Younger Dryas event led to significant cooling at least in parts of the Northern Hemisphere. So while the earth’s climate may prefer to remain at a certain stable state, it is clear that the earth has responded significantly to changes in climate forcings in the past.

Question 2: Regarding human effects on climate, what is the null hypothesis?

I will agree with Willis here – at one level, the null hypothesis is that any climate changes are natural and without human influence. This isn’t controversial in the climate science community; I think every scientist would agree with this. However, this null hypothesis is fairly narrow in scope. I think there is actually a more fundamental null hypothesis, which I’ll call null hypothesis 2 (NH2): are the factors that controlled earth’s climate in the past the same factors that control it today and will continue to do so into the future? In other words are the processes that have affected climate (i.e., the forcings – the sun, volcanic eruptions, greenhouse gases, etc.) in the past affecting climate today and will they continue to do so in the future? A basic premise of any science with an historical aspect (e.g., geology, evolution, etc.) is that the past is the key to the future.

Question 3: What observations tend to support or reject the null hypothesis?

Let me first address NH2. We have evidence that in the past the sun affected climate. And as expected we see the current climate respond to changes in solar energy. In the past we have evidence that volcanoes affected climate. And as expected we see the climate respond to volcanic eruptions (e.g., Mt. Pinatubo). And in the past we’ve seen climate change with greenhouse gases (GHGs). And as expected we are seeing indications that the climate is being affected by changing concentrations of GHGs, primarily CO2. In fact of the major climate drivers, the one changing most substantially over recent years is the greenhouse gas concentration. So what are the indications that climate is changing in response to forcing today as it has in the past? Here are a few:

1. Increasing concentrations of CO2 and other GHGs in the atmosphere

2. Rising temperatures at and near the surface

3. Cooling temperatures in the stratosphere (An expected effect of CO2-warming, but not other forcings)

4. Rising sea levels

5. Loss of Arctic sea ice, particularly multiyear ice

6. Loss of mass from the Greenland and Antarctic ice sheets

7. Recession of most mountain glaciers around the globe

8. Poleward expansion of plant and animal species

9. Ocean acidification (a result of some of the added CO2 being absorbed by the ocean)

It is possible that latter 8 points are completely unrelated to point 1, but I think one would be hard-pressed to say that the above argues against NH2.

Of course none of the above says anything about human influence, so let’s now move on to Willis’ null hypothesis, call it null hypothesis 1 (NH1). Willis notes that modern temperatures are within historical bounds before any possible human influence and therefore claims there is no “fingerprint” of human effects on climate. This seems to be a reasonable conclusion at first glance. However, because of NH2, one can’t just naively look at temperature ranges. We need to think about the changes in temperatures in light of changes in forcings because NH2 tells us we should expect the climate to respond in a similar way to forcings as it has in the past. So we need to look at what forcings are causing the temperature changes and then determine whether if humans are responsible for any of those forcings. We’re seeing increasing concentrations of CO2 and other GHGs in the atmosphere. We know that humans are causing an increase in atmospheric GHGs through the burning of fossil fuels and other practices (e.g., deforestation) – see Question 6 below for more detail. NH2 tells us that we should expect warming and indeed we do, though there is a lot of short-term variation in climate that can make it difficult to see the long-term trends.

So we’re left with two possibilities:

1. NH2 is no longer valid. The processes that have governed the earth’s climate throughout its history have suddenly starting working in a very different way than in the past.

Or

2. NH1 is no longer valid. Humans are indeed having an effect on climate.

Both of these things may seem difficult to believe. The question I would ask is: which is more unbelievable?

Question 4: Is the globe warming?

Willis calls this a trick question and makes the point that the question is meaningless with a time scale. He is correct of course that time scale is important. For NH2, the timescale is one in which the effects of changing forcings can been seen in the climate signals (i.e., where the “signal” of the forcings stands out against the short-term climate variations). For NH1, the relevant period is when humans began to possibly have a noticeable impact on climate. Basically we’re looking for an overall warming trend over an interval and at time-scales that one would expect to see the influence of anthropogenic GHGs.

Question 5: Are humans responsible for global warming?

Willis and I agree – the evidence indicates that the answer is yes.

Question 6: How are humans affecting the climate?

Willis mentions two things: land use and black carbon. These are indeed two ways humans are affecting climate. He mentions that our understanding of these two forcings is low. This is true. In fact the uncertainties are of the same order of as the possible effects, which make it quite difficult to tell what the ultimate impact on global climate these will have. However, Willis fails to directly mention the one forcing that we actually have good knowledge about and for which the uncertainties are much smaller (relative to the magnitude of the forcing): greenhouse gases (GHGs). This is because GHGs are, along with the sun and volcanoes, a primary component that regulates the earth’s climate on a global scale. It might be worth reviewing a few things:

1. Greenhouse gases warm the planet. This comes out of pretty basic radiative properties of the gases and has been known for well over 100 years.

2. Carbon dioxide is a greenhouse gas. This is has been also been known for well over 100 years. There are other greenhouse gases, e.g., methane, nitrous oxide, ozone, but carbon dioxide is the most widespread and longest-lived in the atmosphere so it is more relevant for long-term climate change.

3. The concentration of CO2 is closely linked with temperature – CO2 and temperature rise or fall largely in concert with each other. This has been observed in ice cores from around the world with some records dating back over 800,000 years. Sometimes the CO2 rise lags the temperature rise, as seems to be the case in some of ice ages, but this simply means that CO2 didn’t initiate the rise (it is clear that solar forcing did) and was a feedback. But regardless, without CO2 you don’t get swings between ice ages and interglacial periods. To paraphrase Richard Alley, a colleague at Penn State: “the climate history of the earth makes no sense unless you consider CO2”.

4. The amount of carbon dioxide (and other GHGs) has been increasing. This has been directly observed for over 50 years now. There is essentially no doubt as to the accuracy of these measurements.

5. The increase in CO2 is due to human emissions. There are two ways we know this. First, we know this simply through accounting – we can estimate how much CO2 is being emitted by our cars, coal plants, etc. and see if matches the observed increase in the atmosphere; indeed it does (after accounting for uptake from the oceans and biomass). Second, the carbon emitted by humans has a distinct chemical signature from natural carbon and we see that it is carbon with that human signature that is increasing and not the natural carbon.

6. Given the above points and NH2, one expects the observed temperature rise is largely due to CO2 and that increasing CO2 concentrations will cause temperatures to continue to rise over the long-term. This was first discussed well over 50 years ago.

If you’re interested in more details, I would recommend the CO2 page here: http://www.aip.org/history/climate/co2.htm, which is a supplement to Spencer Weart’s book, “The Discovery of Global Warming”.

Of course, there are other forcings so we don’t expect an exact match between temperatures and GHGs with a completely steady temperature increase. Periods of relatively cooler temperatures, more sea ice, etc. are still part of the natural variations of the climate system that continue to occur. Such periods may last for months or years. The anthropogenic GHG forcing is in addition to the natural forcings, it doesn’t supersede them. And of course, as with any scientific endeavor, there are uncertainties. We can’t give the precise amount warming one gets from a given amount of CO2 (and other GHGs) with 100% certainty; we make the best estimate we can based on the evidence we have. And that tells us that while there are uncertainties on the effect of GHGs, it is very unlikely the effect is negligible and the global effects are much larger than those of land use changes and soot.

Question 7: How much of the post-1980 temperature change is due to humans?

Here Willis says we get into murky waters and that there is little scientific agreement. And indeed this is true when discussing the factors he’s chosen to focus on: land use and soot. This is because, as mentioned above, the magnitudes of these forcings are small and the uncertainties relatively large. But there is broad scientific agreement that human-emitted CO2 has significantly contributed to the temperature change.

Question 8: Does the evidence from the climate models show that humans are responsible for changes in the climate?

Willis answers by claiming that climate models don’t provide evidence and that evidence is observable and measurable data about the real world. To me evidence is any type of information that helps one draw conclusions about a given question. In legal trials, it is not only hard physical evidence that is admitted, but information such as the state of mind of the defendant, motive, memories of eyewitnesses, etc. Such “evidence” may not have the same veracity as hard physical evidence, such as DNA, but nonetheless it can be useful.

Regardless, let me first say that I’m a data person, so I’ve always been a bit skeptical of models myself. We certainly can’t trust them to provide information with complete confidence. It may surprise some people, but most modelers recognize this. However, note that in my response to question 6 above, I never mention models in discussing the “evidence” for the influence of human-emitted CO2 on climate. So avoiding semantic issues, let me say that climate models are useful (though far from perfect) tools to help us understand the evidence for human and other influence on climate. And as imperfect as they may, they are the best tool we have to predict the future.

Question 9: Are the models capable of projecting climate changes for 100 years?

Based on Willis’ answer to Question 1, I’m surprised at his answer here. If the earth has a preferred temperature, which is actively maintained by the climate system, then it should be quite easy to project climate 100 years into the future. In Question 1, Willis proposed the type of well-behaved system that is well-suited for modeling.

However, Willis claims that such a projection is not possible because climate must be more complex than weather. How can a more complex situation be modeled more easily and accurately than a simpler situation? Let me answer that with a couple more questions:

1. You are given the opportunity to bet on a coin flip. Heads you win a million dollars. Tails you die. You are assured that it is a completely fair and unbiased coin. Would you take the bet? I certainly wouldn’t, as much as it’d be nice to have a million dollars.

2. You are given the opportunity to bet on 10000 coin flips. If heads comes up between 4000 and 6000 times, you win a million dollars. If heads comes up less than 4000 or more than 6000 times, you die. Again, you are assured that the coin is completely fair and unbiased. Would you take this bet? I think I would.

But wait a minute? How is this possible? A single coin flip is far simpler than 10000 coin flips. The answer of course is that what is complex and very uncertain on the small scale can actually be predictable within fairly narrow uncertainty bounds at larger scales. To try to predict the outcome of a single coin flip beyond 50% uncertainty, you would need to model: the initial force of the flip, the precise air conditions (density, etc.), along with a host of other things far too complex to do reasonably because, like the weather, there are many factors and their interactions are too complex. However, none of this information is really needed for the 10000 toss case because the influence of these factors tend to cancel each other out over the 10000 tosses and you’re left with a probabilistic question that is relatively easy to model. In truth, many physical systems are nearly impossible to model on small-scales, but become predictable to acceptable levels at larger scales.

Now of course, weather and climate are different than tossing a coin. Whereas coin flips are governed largely by statistical laws, weather and climate are mostly governed by physical laws. And climate models, as I mentioned above, are far from perfect. The relevant question is whether climate can be predicted at a high enough confidence level to be useful. As mentioned in NH2, we find that climate has largely varied predictably in response to past changes in forcing. This is clearly seen in ice core records that indicate a regular response to the change in solar forcing due to changes in the earth’s orbit (i.e., Milankovitch cycles). If climate were not generally predictable, we would expect the earth’s climate to go off into completely different states with each orbital change. But that doesn’t happen – the earth’s climate responds quite regularly to these cycles. Not perfectly of course – it is a complex system – but close enough that the uncertainties are low enough for us to make reasonable predictions.

It is worth mentioning here that while the general response of climate to forcing is steady and predictable, there is evidence for sudden shifts in climate from one regime to another. This doesn’t invalidate NH2, it merely suggests that there may be thresholds in the climate system that can be crossed where the climate transitions quickly into a new equilibrium. When exactly such a transition may occur is still not well known, which adds uncertainty suggest that impacts could come sooner and be more extreme than models suggest. On the other hand, as Willis mentions there may be stabilizing mechanisms that much such transitions less likely.

Finally, Willis says that climate model results are nothing more than the beliefs and prejudices of the programmers made tangible. But if Willis stands by his answer to Question 1 that the climate stays in preferred states, it should be very easy to create a new climate model, without those biases and prejudices, and show that humans aren’t having a significant effect on climate

Question 10: Are current climate theories capable of explaining the observations?

Willis answers no, but he doesn’t answering the question he poses. He instead discusses the climate sensitivity of to CO2 forcing, i.e., 3.7 Watts per square meters leads to a temperature change between 1.5 C and 4.5 C. These numbers are simply a quantitative estimate of NH2, with an associated uncertainty range. Not being able to narrow that range certainly indicates that we still have more to learn. But it’s important to note that as computing power has increased and as our understanding of the climate has increased over the past several decades that range hasn’t shifted much. It hasn’t gone to up to 6.5-9.5 C or down to -4.5 to -0.5 C. So this is further support for NH2. While perhaps we haven’t been able to narrow things down to the exact house in our neighborhood, we’ve gained increasing confidence that the hypothesis that we’re in the right neighborhood is correct.

But getting back to the question Willis posed. Yes, current climate theories are capable of explaining the observations – if one includes GHGs. Increasing GHGs should result in increasing temperatures and that is what we’ve observed. The match isn’t perfect of course, but nor should it expected to be. In addition to anthropogenic GHG forcing, there are other natural forcings still playing a role and there may things we’re not fully accounting for. For example, Arctic sea ice is declining much faster than most models have projected. Remember, where models are wrong does not necessarily provide comfort – things could ultimately be more extreme than models project (particularly if a threshold is crossed).

Question 11: Is the science settled?

This isn’t a particularly well-posed question, for which Willis is not to blame. What “science” are we talking about? If we’re talking about the exact sensitivity of climate to CO2 (and other GHGs), exactly what will be the temperature rise be in the next 100 years, what will happen to precipitation, what will be the regional and local impacts? Then no, the science is not even close to being settled. But if the question is “is NH2 still valid?”, then yes I would say the science is settled. And as a result, we also can say the science is settled with respect to the question: “have human-emitted GHGs had a discernable effect on climate and can we expect that effect to continue in the future?”

Question 12: Is climate science a physical science?

Willis answers “sort of” and that it is a “very strange science” because he defines climate as the “average of weather over a suitably long period of time” and that “statistics is one of the most important parts of climate science”. Our description of climate does indeed rely on statistics because they are useful tools to capture the processes that are too complex to explicitly examine. This is not unlike a lot of physical sciences, from chemistry to biology to quantum physics, which employ statistical approaches to describe processes that can’t be explicitly measured. But statistics are merely a tool. The guts of climate science are the interactions between elements of the climate system (land, ocean, atmosphere, cryosphere) and their response to forcings. This isn’t really all that different from many physical sciences.

Question 13: Is the current peer-review system inadequate, and if so how can it be improved?

There is always room for improvement and Willis makes some good suggestions in this regard. Speaking only from my experience, the process works reasonably well (though not perfectly), quality papers eventually get published and bad papers that slip through the peer-review process and get published can be addressed by future papers.

Question 14: Regarding climate, what action (if any) should we take at this point?

This is of course an economic and political question, not a scientific question, though the best scientific evidence we have can and should inform the answer. So far there isn’t any scientific evidence that refutes NH2 and we conclude that the processes that influenced climate in the past are doing so today and will continue to do so in the future. From this we conclude that humans are having an impact on climate and that this impact will become more significant in the future as we continue to increase GHGs in the atmosphere. Willis answers no and claims that the risks are too low to apply the precautionary principle. The basis for his answer, in practical terms, is his conclusion that NH2 is no longer valid because while GHGs have been a primary climate forcing throughout earth’s history, they are no longer having an impact. This could of course be true, but to me there doesn’t seem to be much evidence to support this idea. But then again, I’m a skeptic.


"Trust and Mistrust"
By: Willis Eschenbach

...
Question 1. Does the earth have a preferred temperature which is actively maintained by the climate system?

To me this is the question that we should answer first. I believe that the answer is yes. Despite millennia-long volcanic eruptions, despite being struck by monstrous asteroids, despite changes in the position of the continents, as near as we can tell the average temperature of the earth has only varied by about plus or minus three percent in the last half-billion years. Over the last ten thousand years, the temperature has only varied by plus or minus one percent. Over the last 150 years, the average temperature has only varied by plus or minus 0.3%. For a system as complex and ever-changing as the climate, this is nothing short of astounding.

Before asking any other questions about the climate, we must ask why the climate has been so stable. Until we answer that question, trying to calculate the climate sensitivity is an exercise in futility.

I have explained in “The Thermostat Hypothesis” what I think is the mechanism responsible for this unexplained stability. My explanation may be wrong, but there must be some mechanism which has kept the global temperature within plus or minus 1% for ten thousand years.

I am, however, definitely in the minority with this opinion.

Question 2. Regarding human effects on climate, what is the null hypothesis?

If we are trying to see if humans have affected the climate, the null hypothesis has to be that any changes in the climate (e.g. changes in temperature, rainfall, snow extent, sea ice coverage, drought occurrence and severity) are due to natural variations.

Question 3. What observations tend to support or reject the null hypothesis?

As I show in “Congenital Climate Abnormalities”, not only are there no “fingerprints” of human effects in the records, but I find nothing that is in any way unusual or anomalous. Yes, the earth’s temperature is changing slightly … but that has been true since the earth has had a temperature.

There is no indication that the recent warming is any different from past warmings. There is more and more evidence that the Medieval Warm period was widespread, and that it was warmer than the present. The Greenland ice cores show that we are at the cold end of the Holocene (the current inter-glacial period). There have been no significant changes in rainfall, floods, sea level rise, Arctic temperatures, or other indicators.

In short, I find no climate metrics that show anything which is anomalous or outside of historical natural variations. In the absence of such evidence, we cannot reject the null hypothesis.

Question 4. Is the globe warming?

This is a trick question. It is a perfect example of a frequently asked question which is totally meaningless. It shows up all the time on public opinion polls, but it is devoid of meaning. To make it meaningful, it needs to have a time period attached to it. Here are some examples of my views on the question:

1 During the last century, the earth warmed slightly (less than 1°C).

2 The earth has generally cooled over the last 12,000 years. We are currently at the cold end of the Holocene (the period since the end of the last Ice Age. See the Greenland and Vostok ice records.

3 The earth has generally warmed since the depths of the Little Ice Age around 1650, at a rate somewhere around a half a degree Celsius per century. See Akasufo, the Central England Temperature (CET), and the Armagh records.

4 The largest warming in any instrumental record occurred around 1680 – 1730. See the CET and Armagh records.

5 The earth was either stable or cooled slightly from about 1945 to 1975.

6 The earth warmed slightly from about 1975 to 1998.

7 There has been no significant warming from 1995 to the present (Feb. 2010). See The Reference Frame, Phil Jones.

I would say that there is widespread scientific agreement on the existence of these general trends. The amount of the warming, however, is far less certain. There is current controversy about both the accuracy of the adjustments to the temperature measurements and the strength of local effects (UHI, poor station siting, warmth from irrigation, etc.). See e.g. McKitrick, Spencer, Christy and Norris, Ladochy et al.., Watts, SurfaceStations, and Jones on these questions.

Question 5. Are humans responsible for global warming?

This is another trick question that often shows up on polls. The question suffers from two problems. First is the lack of a time period discussed above. The second is the question of the amount of responsibility. Generally, the period under discussion is the post-1900 warming. So let me rephrase the question as “Are humans responsible for some part of the late 20th century warming?”

To this question I would say “Yes”. Again, there is widespread scientific agreement on that simplistic question, but as usual, the devil is in the details discussed in Question 4.

Question 6. If the answer to Question 5 is “Yes”, how are humans affecting the climate?

I think that humans affect the climate in two main ways. The first is changes in land use/land cover, or what is called “LU/LC”. I believe that when you cut down a forest, you cut down the clouds. This mechanism has been implicated in e.g. the decline in the Kilimanjaro Glacier. When you introduce widespread irrigation, the additional water vapor both warms and moderates the climate. When you pave a parking lot, local temperatures rise. See e.g. Christie and Norris, Fall et al., Kilimanjaro.

The second main way humans affect climate is through soot, which I will broadly define as black and brown carbon. Black carbon comes mostly from burning of fossil fuels, while brown carbon comes mostly from the burning of biofuels. This affects the climate in two ways. In the air, the soot absorbs incoming solar radiation, and prevents it from striking the ground. This reduces the local temperature. In addition, when soot settles out on ice and snow, it accelerates the melting of the ice and snow. This increases the local temperature by reducing the surface albedo. See e.g. Jacobson.

There is little scientific agreement on this question. A number of scientists implicate greenhouse gases as the largest contributor. Other scientists say that LU/LC is the major mover. The IPCC places values on these and other so-called “forcings”, but it admits that our scientific understanding of many of forcings is “low”.

Question 7. How much of the post 1980 temperature change is due to human activities?

Here we get into very murky waters. Is the overall balance of the warming and cooling effects of soot a warming or a cooling? I don’t know, and there is little scientific agreement on the effect of soot. In addition, as shown above there is no indication that the post 1980 temperature rise is in any way unusual. It is not statistically different from earlier periods of warming. As a result, I believe that humans have had little effect on the climate, other than locally. There is little scientific agreement on this question.

Next, some more general and theoretical questions.

Question 8. Does the evidence from the climate models show that humans are responsible for changes in the climate?

This is another trick question. Climate models do not produce evidence. Evidence is observable and measurable data about the real world. Climate model results are nothing more than the beliefs and prejudices of the programmers made tangible. While the results of climate models can be interesting and informative, they are not evidence.

Question 9. Are the models capable of projecting climate changes for 100 years?

My answer to this is a resounding “no”. The claim is often made that it is easier to project long-term climate changes than short-term weather changes. I see no reason to believe that is true. The IPCC says:

“Projecting changes in climate due to changes in greenhouse gases 50 years from now is a very different and much more easily solved problem than forecasting weather patterns just weeks from now. To put it another way, long-term variations brought about by changes in the composition of the atmosphere are much more predictable than individual weather events.” [from page 105, 2007 IPCC WG1, FAQ 1.2]

To me, that seems very doubtful. The problem with that theory is that climate models have to deal with many more variables than weather models. They have to model all of the variables that weather models contain, plus:

• Land biology

• Sea biology

• Ocean currents

• Ground freezing and thawing

• Changes in sea ice extent and area

• Aerosol changes

• Changes in solar intensity

• Average volcanic effects

• Snow accumulation, area, melt, and sublimation

• Effect of melt water pooling on ice

• Freezing and thawing of lakes

• Changes in oceanic salinity

• Changes in ice cap and glacier thickness and extent

• Changes in atmospheric trace gases

• Variations in soil moisture

• Alterations in land use/land cover

• Interactions between all of the above

• Mechanisms which tend to maximise the sum of work and entropy according to the Constructal Law.

How can a more complex situation be modeled more easily and accurately than a simpler situation? That makes no sense at all.

Next, the problem with weather models has been clearly identified as the fact that weather is chaotic. This means that no matter how well the model starts out, within a short time it will go off the rails. But the same is true for climate, it is also chaotic. Thus, there is no reason to assume that we can predict it any better than we can predict the weather. See Mandelbrot on the chaotic nature of climate.

Finally, climate models have done very poorly in the short-term. There has been no statistically significant warming in the last fifteen years. This was not predicted by a single climate model. People keep saying that the models do well in the long-term … but no one has ever identified when the changeover occurs. Are they unreliable up to twenty-five years and reliable thereafter? Fifty years?

Question 10. Are current climate theories capable of explaining the observations?

Again I say no. For example, the prevailing theory is that forcing is linearly related to climate, such that a change of X in forcing results in a change of Y in temperature. The size of this temperature change resulting from a given forcing is called the “climate sensitivity”. In 1980, based on early simple computer climate models, the temperature resulting from a change in forcing of 3.7 watts per square meter (W/m2) was estimated to result in a temperature change of between 1.5 and 4.5 degrees Celsius. See e.g. Green and Armstrong 2007.

Since 1980, there has been a huge increase in computing power. Since 1980, there has also been a huge increase in the size and complexity of computer models. Since 1980, thousands of man hours and billions of dollars have been thrown at this question. Despite these advances, the modern estimate of the climate sensitivity is almost unchanged from its 1980 value.

To me, this lack of any advance in accuracy indicates that we have an incorrect understanding of the forces governing the climate. Otherwise, our bigger, faster and better models would have narrowed the uncertainty of the climate sensitivity. But they have not.

Question 11. Is the science settled?

To this one I would answer no, no, a thousand times no. We are just a the beginning of the study of climate. New information and new theories and new forcings are put forward on a regular basis. See e.g. Lu. The data is poor, short, and full of holes. The signal is tiny and buried in a huge amount of noise. We don’t know if the earth has a thermostat. In short, the study of climate is an infant science which is still poorly understood.

Question 12. Is climate science a physical science?

Well, sort of. It is a very strange science, in that to my knowledge it is the only physical science whose object of study is not a thing, not a physical object or phenomenon, but an average. This is because climate is defined as the average of weather over a suitably long period of time (usually taken to be 30 years.) The implications of this are not widely appreciated. Inter alia, it means that statistics is one of the most important parts of climate science.

Unfortunately, a number of what I might call the “leading blights” of climate science, like Michael Mann with his HockeySchtick, have only the most rudimentary understanding of statistics. This initially got him into trouble in his foray into the area of paleoclimate statistics, trouble which he has only compounded by his later statistical errors.

Question 13. Is the current peer-review system inadequate, and if so, how can it be improved?

There are a number of problems with the current peer-review system, some of which are highlighted in the abuses of that system revealed in the CRU emails.

There are several easy changes we could make in peer review that would help things immensely:

1. Publish the names of the reviewers and their reviews along with the paper. The reviews are just as important as the paper, as they reveal the views of other scientists on the issues covered. This will stop the “stab in the back in the dark” kind of reviewing highlighted in the CRU emails.

2. Do not reveal the names of the authors to the reviewers. While some may be able to guess the names from various clues in the paper, the reviews should be “double-blind” (neither side knows the names of the others) until publication.

3. Do the reviewing online, in a password protected area. This will allow each reviewer to read, learn from, and discuss the reviews of others in real time. The process often takes way too long, and consists of monologues rather than a round-table discussion of the problems with the paper.

4. Include more reviewers. The CRU emails show that peer review is often just an “old-boys club”, with the reviewing done by two or three friends of the author. Each journal should allow a wide variety of scientists to comment on pending papers. This should include scientists from other disciplines. For example, climate science has suffered greatly from a lack of statisticians reviewing papers. As noted above, much of climate science is statistical analysis, yet on many papers either none or only the most cursory statistical review has been done. Also, engineers should be invited to review papers as well. Many theories would benefit from practical experience. Finally, “citizen scientists” such as myself should not be excluded from the process. The journals should solicit as wide a range of views on the subject as they can. This can only help the peer review process.

5. The journals must insist on the publication of data and computer codes. A verbal description of what mathematics has been done is totally inadequate. As we saw in the “HockeyStick”, what someone thinks or says they have done may not be what they actually did. Only an examination of the code can reveal that. Like my high science teacher used to say, “Show your work.”

Question 14. Regarding climate, what action (if any) should we take at this point?

I disagree with those who say that the “precautionary principle” means that we should act now. I detail my reasons for this assertion at “Climate Caution and Precaution”. At that page I also list the type of actions that we should be taking, which are “no regrets” actions. These are actions which will have beneficial results whether or not the earth is warming...
 
anomalies2_300.png


big_ice_age_ending_cartoon.jpg
 
Last edited:

J. Storrs Hall, Ph.D.
I’m looking at the temperature record as read from this central Greenland ice core ( http://www.ncdc.noaa.gov/paleo/metadata/noaa-icecore-2475.html ). It gives us about as close as we can come to a direct, experimental measurement of temperature at that one spot for the past 50,000 years. As far as I know, the data are not adjusted according to any fancy computer climate model or anything else like that.

So what does it tell us about, say, the past 500 years? (the youngest datum is age=0.0951409 (thousand years before present) — perhaps younger snow doesn’t work so well?):

histo6.png

Well, whaddaya know — a hockey stick. In fact, the “blade” continues up in the 20th century at least another half a degree. But how long is the handle? How unprecedented is the current warming trend?

histo5.png

Yes, Virginia, there was a Medieval Warm Period, in central Greenland at any rate. But we knew that — that’s when the Vikings were naming it Greenland, after all. And the following Little Ice Age is what killed them off, and caused widespread crop failures (and the consequent burning of witches) across Europe. But was the MWP itself unusual?

histo4.png

Well, no — over the period of recorded history, the average temperature was about equal to the height of the MWP. Rises not only as high, but as rapid, as the current hockey stick blade have been the rule, not the exception.

histo3.png

In fact for the entire Holocene — the period over which, by some odd coincidence, humanity developed agriculture and civilization — the temperature has been higher than now, and the trend over the past 4000 years is a marked decline. From this perspective, it’s the LIA that was unusual, and the current warming trend simply represents a return to the mean. If it lasts.

histo2.png

From the perspective of the Holocene as a whole, our current hockeystick is beginning to look pretty dinky. By far the possibility I would worry about, if I were the worrying sort, would be the return to an ice age — since interglacials, over the past half million years or so, have tended to last only 10,000 years or so. And Ice ages are not conducive to agriculture.

histo1.png

… and ice ages have a better claim on being the natural state of Earth’s climate than interglacials. This next graph, for the longest period, we have to go to an Antarctic core (Vostok):

vostok.png

In other words, we’re pretty lucky to be here during this rare, warm period in climate history. But the broader lesson is, climate doesn’t stand still. It doesn’t even stand stay on the relatively constrained range of the last 10,000 years for more than about 10,000 years at a time.

Does this mean that CO2 isn’t a greenhouse gas? No.

Does it mean that it isn’t warming? No.

Does it mean that we shouldn’t develop clean, efficient technology that gets its energy elsewhere than burning fossil fuels? Of course not. We should do all those things for many reasons — but there’s plenty of time to do them the right way, by developing nanotech. (There’s plenty of money, too, but it’s all going to climate science at the moment. ) And that will be a very good thing to have done if we do fall back into an ice age, believe me.

For climate science it means that the Hockey Team climatologists’ insistence that human-emitted CO2 is the only thing that could account for the recent warming trend is probably poppycock.
 
Last edited:
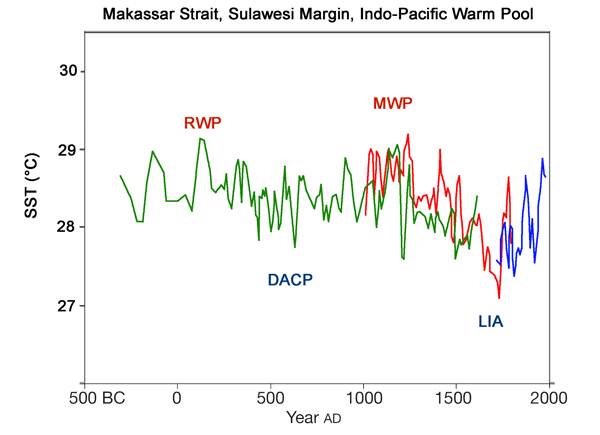
Makassar Strait, Sulawesi Margin, Indo-Pacific Warm Pool
----------------------------------------------------------

Reference:
Oppo, D.W., Rosenthal, Y. and Linsley, B.K. 2009. 2,000-year-long temperature and hydrology reconstructions from the Indo-Pacific warm pool. Nature 460: 1113-1116.
Description
Oppo et al. derived a continuous sea surface temperature (SST) reconstruction from the Indo-Pacific Warm Pool (IPWP), which they describe as "the largest reservoir of warm surface water on the earth and the main source of heat for the global atmosphere." This history -- which was based on δ18O and Mg/Ca data obtained from samples of the planktonic foraminifera Globigerinoides ruber found in two gravity cores, a nearby multi-core (all at 3°53'S, 119°27'E), and a piston core (at 5°12'S, 117°29'E) that were recovered from the Makassar Strait on the Sulawesi margin -- spans the past two millennia and, as they describe it, "overlaps the instrumental record, enabling both a direct comparison of proxy data to the instrumental record and an evaluation of past changes in the context of twentieth century trends." Reconstructed SSTs were, in their words, "warmest from AD 1000 to AD 1250 and during short periods of first millennium." From the authors' Figure 2b, adapted below, we calculate that the Medieval Warm Period was about 0.4°C warmer than the Current Warm Period.


l1_makassarstrait2.gif
 

Where's The Missing Heat?


http://www2.ucar.edu/news/missing-heat-may-affect-future-climate-change

"Missing" heat may affect future climate change

April 15, 2010
BOULDER—Current observational tools cannot account for roughly half of the heat that is believed to have built up on Earth in recent years, according to a “Perspectives” article in this week’s issue of Science...


energy-sm.jpg
Satellite sensors show that the amount of greenhouse-trapped solar energy, or heat, has risen over recent years. But in the past decade, there has been a growing divergence between the satellite readings and ocean observations that indicate the build-up of heat is slowing. This "missing" heat could, in part, be the result of instrument error or incorrect data processing, but much of it may be going into the deep ocean or elsewhere on Earth that is beyond the reach of current sensors. This graph shows simplified estimates of the measurements of heat. (Courtesy Science).


...“Either the satellite observations are incorrect, says Trenberth, or, more likely, large amounts of heat are penetrating to regions that are not adequately measured, such as the deepest parts of the oceans. Compounding the problem, Earth’s surface temperatures have largely leveled off in recent years. Yet melting glaciers and Arctic sea ice, along with rising sea levels, indicate that heat is continuing to have profound effects on the planet.”

“A percentage of the missing heat could be illusory, the result of imprecise measurements by satellites and surface sensors or incorrect processing of data from those sensors, the authors say. Until 2003, the measured heat increase was consistent with computer model expectations. But a new set of ocean monitors since then has shown a steady decrease in the rate of oceanic heating, even as the satellite-measured imbalance between incoming and outgoing energy continues to grow.”...

http://pielkeclimatesci.wordpress.c...ystem-my-comments-on-this-ncar-press-release/

...Trenberth’s [and co-author, NCAR scientist John Fasullo], however, are grasping for an explanation other than the actual real world implication of the absence of this heat.

First, if the heat was being sequestered deeper in the ocean (lower than about 700m), than we would have seen it transit through the upper ocean where the data coverage has been good since at least 2005. The other reservoirs where heat could be stored are closely monitored as well (e.g. continental ice) as well as being relatively small in comparison with the ocean.​

Second, the melting of glaciers and continental ice can be only a very small component of the heat change (e.g. see Table 1 in Levitus et al 2001 “Anthropogenic warming of Earth’s climate system”. Science).​

Thus, a large amount heat (measured as Joules) does not appear to be stored anywhere; it just is not there.
-Roger Pielke, Ph.D.


http://joannenova.com.au/2008/10/the-missing-hotspot/ :
observed%20temperatures%20worldwide%20flat.jpg

...there are a few points and opinions I’d like to share.

1) THE MISSING ENERGY IS IN THE SOLAR, NOT THE INFRARED
Trenberth and Fasullo don’t highlight the fact that the “missing” energy is not in the infrared, which is where manmade global warming allegedly originates, but in the reflected solar component. The infrared component has essentially no trend between March 2000 and December 2007 (the last CERES Earth radiation budget data I have analyzed).

This suggests a small decrease in low or mid-level cloud cover, letting more sunlight in. The fact that the extra energy is not showing up as a temperature increase in the ocean makes me suspect the measurements themselves. If there is a problem with the Earth radiation budget measurements, then obviously there is no missing energy.

2) MAYBE THE DISCREPANCY WAS ACTUALLY BEFORE 2000
Trenberth and Fasullo correctly point out that the absolute accuracy of these radiation budget instruments is not good enough to measure very small radiation imbalances…just the CHANGE in that imbalance over time. Well then maybe it was the period BEFORE 2000 where there was an imbalance, with extra energy being lost by the Earth, but no cooling, and NOW the solar and infrared flows are once again in balance. Just a thought.

3) OCEAN TEMPERATURES ARE MUCH EASIER TO MEASURE THAN THE EARTH’S RADIATION BUDGET
Trenberth and Fasullo briefly acknowledge that there might be measurement errors involved here, and I would argue that this is much more likely in the Earth radiation budget measurements than in the ocean temperature measurements. The amount of solar energy the Earth absorbs is particularly difficult to measure because a monitoring satellite is only a single point in space, whereas the total amount of sunlight being reflected off clouds goes in all different directions.

Because of this complication, many detailed calculations must be made by the dataset developers to estimate the energy flows at all angles, based upon years of accumulated statistics with radiation budget instruments that measure some of the clouds at different angles. I think the dataset developers are doing the best they can with the available information, but what we are asking the data to reveal to us is a very small signal.

4) “YOU’VE LOST ANOTHER SUBMARINE”?
We have already been dealing with some missing global warming in the last 10 to 30 years, since 95% of the climate models suggest our carbon dioxide emissions should have caused more global warming than what has been observed — and that is due to an infrared effect. Now, we are told that there is missing SOLAR energy, too?

This reminds me of the 1990 movie, The Hunt for Red October. After an entire movie dealing with a missing experimental Soviet submarine, the end of the movie shows the Soviet Ambassador asking the U.S. to help find…what!?…ANOTHER missing submarine? It was a funny line.

I’m sorry, but at some point we need to ask whether all of this missing warming and energy are missing because they really do not exist. This is Roger Pielke, Sr.’s opinion, and at this point it is mine as well. Only time will tell.

-Roy W. Spencer, Ph.D.

http://www.drroyspencer.com/2010/04/some-comments-on-earth’s-“missing-energy”/
 
Last edited:


By: "Micheal"
http://joannenova.com.au/2008/10/the-missing-hotspot/


January 5th, 2009

There are two ways of supporting or disproving theories. The first is by experimental observation, the second is by theoretical analysis. The first has been discussed endlessly in relation to AGW on this site and others. Let me offer an attempt at the second approach.

As a preamble however I would like to point out that the study of the absorption of radiant energy by matter is NOT climatology, it is spectroscopy. In fact most of the science behind climatology is derived from other disciplines thus it is not justifiable to take the view that only input from climatologists is relevant. In my case, I have spent the last 33 years very successfully carrying out research for a major spectroscopy company.

Having become interested in the AGW issue I tried to derive the direct effect of CO2 from first principles. What I found was that the relationship between CO2 concentration and retained energy was logarithmic and that each doubling of CO2 would retain about an additional 3.5 watts/sq meter. Consulting the literature I find that the logarithmic relationship is widely established, I simply re-derived an already known relationship. As to the magnitude, the 4th (ie: latest) IPCC report states that the increase in CO2 concentration from 280 to 390 ppm has increased retained energy by 1.77 watts/sq meter. 280 to 390 ppm represents 0.48 doublings so the IPCC number is 1.77/0.48 or 3.7 watts/sq meter. Pretty reasonable agreement. That means the increase from 390 to 560 ppm – a further 0.52 doublings will increase retained energy by 1.9 watts/sq meter. Using Stefan’s law relating temperature with energy radiated by a black body (known and proven for more than a century) an additional 1.9 watts/sq meter will increase the temperature of earth’s surface by about 0.34 degrees C. That’s a long way from the claimed 3+ degrees C – how come? The claimed answer is positive feedback from water vapour. My immediate thought on hearing this was to note that every single naturally stable system I can think of exhibits net negative feedback so to suggest that climate (which is clearly stable) exhibits strong positive feedback makes me very suspicious, however suspicion is not evidence so lets look at the numbers.

To get 3 degrees temperature rise requires an additional 16.5 watts/sq meter (again from Stefan’s law). If 1.9 comes from CO2, the remainder, 14.6 must come from water vapour. That would mean the positive feedback co-efficient was 14.6/16.5 or 0.88 (where 1 = runaway) WOW. Looking up the relationship between temperature and water vapour pressure in the CRC handbook I find that a 3 degree temperature increase results in approximately a 30% increase in water vapour concentration (at constant relative humidity). The logarithmic relationship applies to all greenhouse gases including water thus a 30% increase is 0.38 doublings implying that each doubling of water vapour contributes an additional 14.6/.38 watts or 38 watts/sq meter. To put this in perspective, water vapour at present only contributes 84 watts/sq meter in total. A sensitivity as large as this raises many extremely serious paradoxes and is, I believe absolutely impossible. This post is already too long for me to enumerate these but if anyone is interested I am more than willing to outline some of the paradoxes in a subsequent posting.

The models making this prediction also predict that the impact of this water vapour feedback mechanism is a hot spot in the tropics at an altitude of about 8 km. According to the models, if the positive feedback effect of water is true then this region should be warming at least 2 times as fast as the surface. However again when I read the literature I find that 1000’s of balloon measurements and the satellite measurements all fail to find such a hot spot- and in fact this region is warming significantly less than the surface. The prediction is not supported experimentally suggesting the original hypothesis is false.

The above only considers positive feedback from water vapour but in fact water vapour also generates very powerful negative feedback. Atmospheric water vapour gives rise to clouds and they cause cooling because they reflect incoming energy from the sun back into space. For Earth the albedo is dominated by clouds. At present it is about 0.3 which means that 30% of the incoming energy from the sun is reflected back into space (about 100 watts/sq meter- which is greater in magnitude but opposite in sign to the greenhouse impact of water vapour 84 watts/sq meter). So to consider one without the other is biased thinking.

What is the relationship between water vapour concentration and cloud levels? I admit I don’t know for sure but I suspect it is much closer to linear than logarithmic. If there are two opposite feedback mechanisms of similar magnitude, one varying logarithmically with concentration and the other linearly, linear will dominate as the concentration rises. This again suggests feedback from water vapour is more likely to be negative than positive. If so, the direct 0.34 degree rise from an increase of CO2 to 560 ppm would be reduced not increased by the impact of water vapour.

There is also experimental evidence easily observable by any lay person that the feedback from water vapour is negative.


January 6th, 2009

In my previous post I said I would outline evidence easily experienced by a lay person suggesting that water exerts a negative feedback effect. Here it is.

The IPCC model is based on massive positive feedback in our climate system yet every stable natural system that I can think of exhibits strong negative feedback around the equilibrium point. Negative feedback is the opposite of positive feedback. It acts to oppose any disturbance acting on a system and seeks to maintain the current equilibrium. In short it is a stabilising factor whereas positive feedback is a destabilising factor. Long term stability of any system almost guarantees that there is strong negative or stabilising feedback in operation. The climate, while showing periodic variations, has been stable enough for life to form and flourish for millions of years despite significant changes in forcings over the millennia and this makes it virtually certain that strong negative feedback is in operation. Any analysis purporting to show otherwise should be viewed with considerable circumspection. It suggests a strong likelihood that the model is either incomplete or seriously flawed.

We have all experienced the very significant temperature difference between a clear night and a cloudy night in winter. Clear nights are much colder than cloudy nights. Clouds act in exactly the same way as greenhouse gasses, by trapping energy radiated from the surface and returning it to the surface instead of allowing it to radiate out to space. What our senses are showing us is that greenhouse effects are not just long time constant, global issues. They are easily discerned in our local environment over timescales as short as an hour or two.

Now consider the following scenario. We know the earth rotates about an axis tilted about 23 degrees relative to the sun, which is what gives us the seasons and what sets the tropics of Cancer and Capricorn. Imagine a location on the tropic of Capricorn (23 degrees south) – say Mackay in Queensland. In summer the sun is directly overhead – average solar input of around 310 watts/sq meter. In winter the sun is at maximum elevation 45 degrees – average solar input of around 220 watts/sq meter. That is a difference summer to winter of about 90 watts/sq meter which, if there was neither positive nor negative feedback, would give a temperature difference summer to winter of about 16 degrees (from Stefan’s law). The positive feedback suggested by the IPCC model, would act on this forcing in exactly the same way as the claimed forcing from CO2 rise and would inflate the 16 degrees to about 90 degrees C, extinguishing all life in Mackay. Yet the summer winter temperature difference in Mackay is only about 6 degrees. That is not only far less than IPCC’s 90 degrees but is far less even than the 16 degrees predicted in the absence of any feedback at all. How is that possible?

Maybe the thermal mass of the environment averages out much of the summer winter difference? Unlikely, considering the significant temperature change between day and night. If the temperature can change significantly in a few hours it could certainly change profoundly over 6 months. Also, if the above were the reason one would also expect to see it similarly averaged out in places like Melbourne, yet anyone living there can testify first hand that such is not the case, the summer/winter variation is greater than at Mackay.

What does stand out at Mackay relative to Melbourne is that the humidity is much higher in summer than it is in winter. Higher humidity means more water vapour content in the air. According to the IPCC model, this should translate to even more greenhouse heat retention and thus even higher temperatures. Now remember our experiences with cloudy versus clear nights, the effect should be easily discernable in our local environment over a few hours. Yet the effect is not observed, more water vapour is not leading to higher temperatures in fact just the opposite would seem to be the case. This suggests that maybe water vapour causes a net negative feedback effect rather than net positive feedback.

Certainly increasing atmospheric water vapour does increase retained energy to a very small degree but this impact is nowhere near as strong as claimed by IPCC. It is also far from the only effect of water in our environment and some of the other effects exhibit strong negative feedback. For example, greater humidity leads to more clouds which reflect a larger fraction of the incoming solar energy back out to space and away from Earth’s surface. Or the very large amount of energy absorbed by evaporating water. Energy which is then transported upwards and eventually re-radiated high up in the atmosphere where the greenhouse effect is reduced. Or the energy taken to lift all that water several kilometres into the atmosphere against earth’s gravity (after all that is where the energy for hydroelectricity comes from). These are all negative feedback effects. (in fact the energy absorbed by evaporating water is a very significant factor in reducing the summer winter temperature difference at McKay and in the tropics generally).

Is this consistent with a larger summer/winter temperature variation in Melbourne? Yes it is, because in Melbourne the humidity summer versus winter varies less so the negative feedback from water vapour is correspondingly smaller.

The albedo of water (eg: oceans, seas and lakes) is about 4% (only surface reflection). The albedo of vegetation covered land is also of a similar magnitude. The albedo of snow and ice is very high but snow and ice are only extensive on Earth near the poles where the insolation is extremely low which means that the energy available for reflection is a very small portion of the total solar energy reaching earth. What all that means is that most of Earth’s albedo comes about from the atmosphere – some no doubt from dust and particulates but clouds are a major factor. The albedo of Earth is 0.3 which means it is responsible for reflection of 100 watts/sq meter of energy back into space. What this means is that the negative feedback effect of water vapour through clouds is very close to the positive feedback greenhouse effect. However the positive feedback effect is logarithmic with concentration whereas the negative feedback effect is likely to be much closer to linear with concentration and therefore changing faster with changes in concentration.

Such a situation is well known and understood in engineering systems. It gives rise to a stable operating point around the concentration where the two effects balance. Negative feedback occurs around this operating point. In our climate, water vapour concentration is very closely tied to temperature. A reduction in temperature reduces water vapour concentration which reduces the effects of clouds more than the greenhouse effect so the temperature goes up. A rise in temperature increase water vapour which increases the effects of clouds more than the greenhouse effect and the temperature goes down again.

I strongly suspect that the fact that the positive greenhouse effects of water vapour are equal to the negative effects of clouds at the average temperature of our planet is no accident. In fact I suspect that the average temperature of Earth is controlled by this equilibrium point. That means not only that water vapour exerts a dominant negative feedback effect but that it is the controlling impact on global temperature. Factors that change the equilibrium such as cosmic rays which slightly modulate cloud formation or other greenhouse gases that add to the overall greenhouse effect will slightly shift the equilibrium but this is very much a second order (and minor) effect.
 
Earth Day Predictions, 1970

"We have about five more years at the outside to do something."
Kenneth Watt, ecologist

"Civilization will end within 15 or 30 years unless immediate action is taken against problems facing mankind."
George Wald, Harvard Biologist

"We are in an environmental crisis which threatens the survival of this nation, and of the world as a suitable place of human habitation."
Barry Commoner, Washington University biologist

"Man must stop pollution and conserve his resources, not merely to enhance existence but to save the race from intolerable deterioration and possible extinction."
New York Times editorial, the day after the first Earth Day

"Population will inevitably and completely outstrip whatever small increases in food supplies we make. The death rate will increase until at least 100-200 million people per year will be starving to death during the next ten years."
Paul Ehrlich, Stanford University biologist

"By...[1975] some experts feel that food shortages will have escalated the present level of world hunger and starvation into famines of unbelievable proportions. Other experts, more optimistic, think the ultimate food-population collision will not occur until the decade of the 1980s."
Paul Ehrlich, Stanford University biologist

"It is already too late to avoid mass starvation."
Denis Hayes, chief organizer for Earth Day

"Demographers agree almost unanimously on the following grim timetable: by 1975 widespread famines will begin in India; these will spread by 1990 to include all of India, Pakistan, China and the Near East, Africa. By the year 2000, or conceivably sooner, South and Central America will exist under famine conditions....By the year 2000, thirty years from now, the entire world, with the exception of Western Europe, North America, and Australia, will be in famine."
Peter Gunter, professor, North Texas State University

"Scientists have solid experimental and theoretical evidence to support...the following predictions: In a decade, urban dwellers will have to wear gas masks to survive air pollution...by 1985 air pollution will have reduced the amount of sunlight reaching earth by one half...."
Life Magazine, January 1970

"At the present rate of nitrogen buildup, it's only a matter of time before light will be filtered out of the atmosphere and none of our land will be usable."
Kenneth Watt, Ecologist

"Air pollution...is certainly going to take hundreds of thousands of lives in the next few years alone."
Paul Ehrlich, Stanford University biologist

"We are prospecting for the very last of our resources and using up the nonrenewable things many times faster than we are finding new ones."
Martin Litton, Sierra Club director

"By the year 2000, if present trends continue, we will be using up crude oil at such a rate...that there won't be any more crude oil. You'll drive up to the pump and say, `Fill 'er up, buddy,' and he'll say, `I am very sorry, there isn't any.'"
Kenneth Watt, Ecologist

"Dr. S. Dillon Ripley, secretary of the Smithsonian Institute, believes that in 25 years, somewhere between 75 and 80 percent of all the species of living animals will be extinct."
Sen. Gaylord Nelson

"The world has been chilling sharply for about twenty years. If present trends continue, the world will be about four degrees colder for the global mean temperature in 1990, but eleven degrees colder in the year 2000. This is about twice what it would take to put us into an ice age."
Kenneth Watt, Ecologist
 

Arctic research may be threatened by global cooling - scientist

23/04/2010 14:33
Research for mineral resources in the Arctic may be hampered by a global trend towards colder weather rather than global warming, a Russian scientist said on Friday.

Prof. Oleg Pokrovsky of the Voeikov Main Geophysical Observatory (MGO) said the cold snap began in 1998 and the temperatures are predicted to return to the lows of the 1950s-1960s and reach their peak in 15 years.

Despite the predictions of global warming, which has been the greatest economic and political challenge, most parts of the world have recently seen widespread low temperatures and extremely heavy snowfalls.

"Now all the components of the climate system are entering the negative phase. Politicians who placed their bets on global warming may lose the pot," Pokrovsky said at a conference on marine research in the Polar regions.

The scientist explains the possible climate miscalculation by the fact that most meteorological stations in the United States are located in urban areas which are affected by the city's microclimate where the temperature is usually higher.

"We do not know everything that happens. The climate system is extremely complicated and the Intergovernmental Panel on Climate Change (IPCC) is not the highest authority," Pokrovsky said.

The scientist has warned, however, that global cooling could jeopardize the race of world powers for the largely unexplored mineral resources in the Arctic, which has recently intensified.

"The northern marine passage will freeze and it will be impossible to pass through it without icebreakers," Pokrovsky said. "I think the development of the shelf will face large problems," he added.

ST. PETERSBURG, April 23 (RIA Novosti)


http://en.rian.ru/Environment/20100423/158714403.html
 
Apr 22, 2010
Climate Science In Denial
By Richard S. Lindzen, Ph.D.
Alfred P. Sloan Professor of Meteorology
Massachusetts Institute of Technology
Fellow, American Academy of Arts and Sciences, AGU, AAAS, and AMS
Member Norwegian Academy of Science and Letters
Member National Academy of Sciences

In mid-November of 2009 there appeared a file on the Internet containing thousands of emails and other documents from the Climatic Research Unit at the University of East Anglia in Great Britain. How this file got into the public domain is still uncertain, but the emails, whose authenticity is no longer in question, provided a view into the world of climate research that was revealing and even startling. In what has come to be known as “climategate,” one could see unambiguous evidence of the unethical suppression of information and opposing viewpoints, and even data manipulation. The Climatic Research Unit is hardly an obscure outpost; it supplies many of the authors for the United Nations’ Intergovernmental Panel on Climate Change (IPCC). Moreover, the emails showed ample collusion with other prominent researchers in the United States and elsewhere.


One might have thought the revelations would discredit the allegedly settled science underlying currently proposed global warming policy, and, indeed, the revelations may have played some role in the failure of last December’s Copenhagen climate conference to agree on new carbon emissions limits. But with the political momentum behind policy proposals and billions in research funding at stake, the impact of the emails appears to have been small.
The general approach of the official scientific community (at least in the United States and the United Kingdom) has been to see whether people will bother to look at the files in detail (for the most part they have not), and to wait until time diffuses the initial impressions in order to reassert the original message of a climate catastrophe that must be fought with a huge measure of carbon control.


This reassertion, however, continues to be suffused by illogic, nastiness and outright dishonesty. There were, of course, the inevitable investigations of individuals like Penn State University’s Michael Mann (who manipulated data to create the famous “hockey stick” climate graph) and Phil Jones (director of the CRU). The investigations were brief, thoroughly lacking in depth, and conducted, for the most part, by individuals already publicly committed to the popular view of climate alarm. The results were whitewashes that are quite incredible given the actual data.


In addition, numerous professional societies, including the American Society of Agronomy, the American Society of Plant Biologists and the Natural Science Collections Alliance, most of which have no expertise whatever in climate, endorse essentially the following opinion: That the climate is warming, the warming is due to man’s emissions of carbon dioxide, and continued emissions will lead to catastrophe.


We may reasonably wonder why they feel compelled to endorse this view. The IPCC’s position in its Summary for Policymakers from their Fourth Assessment (2007) is weaker, and simply points out that most warming of the past 50 years or so is due to man’s emissions. It is sometimes claimed that the IPCC is 90% confident of this claim, but there is no known statistical basis for this claim - it’s purely subjective. The IPCC also claims that observations of globally averaged temperature anomaly are also consistent with computer model predictions of warming.


There are, however, some things left unmentioned about the IPCC claims. For example, the observations are consistent with models only if emissions include arbitrary amounts of reflecting aerosols particles (arising, for example, from industrial sulfates) which are used to cancel much of the warming predicted by the models. The observations themselves, without such adjustments, are consistent with there being sufficiently little warming as to not constitute a problem worth worrying very much about.


In addition, the IPCC assumed that computer models accurately included any alternative sources of warming— most notably, the natural, unforced variability associated with phenomena like El Nino, the Pacific Decadal Oscillation, etc. Yet the relative absence of statistically significant warming for over a decade shows clearly that this assumption was wrong. Of course, none of this matters any longer to those replacing reason with assertions of authority.


Consider a letter of April 9 to the Financial Times by the presidents of the U.S. National Academy of Science and the Royal Society (Ralph Cicerone and Martin Rees, respectively). It acknowledges that climategate has contributed to a reduced concern among the public, as has unusually cold weather. But Messrs. Cicerone and Rees insist that nothing has happened to alter the rather extreme statement that climate is changing and it is due to human action. They then throw in a very peculiar statement (referring to warming), almost in passing: “Uncertainties in the future rate of this rise, stemming largely from the ‘feedback’ effects on water vapour and clouds, are topics of current research.”


Who would guess, from this statement, that the feedback effects are the crucial question? Without these positive feedbacks assumed by computer modelers, there would be no significant problem, and the various catastrophes that depend on numerous factors would no longer be related to anthropogenic global warming. What is to say, the issue relevant to policy is far from settled. Nonetheless, the letter concludes: “Our academies will provide the scientific backdrop for the political and business leaders who must create effective policies to steer the world toward a low-carbon economy.” In other words, the answer is settled even if the science is not.


In France, several distinguished scientists have recently published books criticizing the alarmist focus on carbon emissions. The gist of all the books was the scientific standards for establishing the alarmist concern were low, and the language, in some instances, was intemperate. In response, a letter signed by 489 French climate scientists was addressed to “the highest French scientific bodies: the Ministry of Research, National Center for Scientific Research, and Academy of Sciences” appealing to them to defend climate science against the attacks. There appeared to be no recognition that calling on the funding agencies to take sides in a scientific argument is hardly conducive to free exchange.


The controversy was, and continues to be, covered extensively by the French press. In many respects, the French situation is better than in the U.S., insofar as the “highest scientific bodies” have not officially taken public stances - yet.


Despite all this, it does appear that the public at large is becoming increasingly aware that something other than science is going on with regard to climate change, and that the proposed policies are likely to cause severe problems for the world economy. Climategate may thus have had an effect after all. But it is unwise to assume that those who have carved out agendas to exploit the issue will simply let go without a battle. One can only hope that the climate alarmists will lose so that we can go back to dealing with real science and real environmental problems such as assuring clean air and water. The latter should be an appropriate goal for Earth Day.
 
http://www.gsfc.nasa.gov/gsfc/service/gallery/fact_sheets/earthsci/eos/global_warming.pdf

Excerpted from NASA Facts
April, 1998
Global Warming
"Modeling"

Getting reliable predictions from models is difficult
because many of the secondary processes are not
understood. For example, when temperatures start to
warm because of the direct radiative effect of increasing
carbon dioxide, will clouds increase or decrease? Will
they let in less radiation from the sun, or more? These
secondary processes are important.

The direct radiative effect of doubling carbon dioxide is
relatively small, and there is not much disagreement on
this point among models. Where models conflict is in
regard to the secondary, or feedback effects. Models
that predict a very large warming from carbon dioxide
show cloud cover changes that greatly amplify the
warming effects, while models that predict more modest
warming show that clouds have a small or even
damping effect on the warming.

Can we match the observation of temperature trends
with the model predictions? The temperature record of
the past hundred years does show a warming trend, by
approximately 0.5°C. However, the observed warming
trend is not entirely consistent with the carbon dioxide
change. Most of the temperature increase occurred
before 1940, after which Earth started to cool until the
early seventies, when warming resumed. Carbon
dioxide, on the other hand, has been increasing steadily
throughout the past century. Other factors that could
have affected climate during this period include the
possible change in the solar energy reaching Earth, the
cooling effects of volcanic aerosols, and the possibility
that sulfur dioxide and other pollutants might be
affecting the amount of solar radiation that is reflected
back to space. Some of these effects can cause a
cooling that could counteract the warming due to
carbon dioxide and other greenhouse gases. All of
these effects would have to be taken into account and
appropriately modeled in order to predict the changes
that one might expect in the next century.
 
Last edited:
The amount of CO2 released from soils worldwide each year is estimated to be about 8-10 times greater than the amount released by humans.


http://today.uci.edu/news/2010/04/nr_soilcarbon_100426.php
— Irvine, Calif., April 26, 2010 —

The physiology of microbes living underground could determine the amount of carbon dioxide emitted from soil on a warmer Earth, according to a study published online this week in Nature Geoscience.

Researchers at UC Irvine, Colorado State University and the Yale School of Forestry & Environmental Studies found that as global temperatures increase, microbes in soil become less efficient over time at converting carbon in soil into carbon dioxide, a key contributor to climate warming.

Microbes, in the form of bacteria and fungi, use carbon for energy to breathe, or respire, and to grow in size and in number. A model developed by the researchers shows microbes exhaling carbon dioxide furiously for a short period of time in a warmer environment, leaving less carbon to grow on. As warmer temperatures are maintained, the less efficient use of carbon by the microbes causes them to decrease in number, eventually resulting in less carbon dioxide being emitted into the atmosphere.

“Microbes aren’t the destructive agents of global warming that scientists had previously believed,” said Steven Allison, assistant professor of ecology & evolutionary biology at UCI and lead author on the study. “Microbes function like humans: They take in carbon-based fuel and breathe out carbon dioxide. They are the engines that drive carbon cycling in soil. In a balanced environment, plants store carbon in the soil and microbes use that carbon to grow. The microbes then produce enzymes that convert soil carbon into atmospheric carbon dioxide.”

The study, “Soil-Carbon Response to Warming Dependent on Microbial Physiology,” contradicts the results of older models that assume microbes will continue to spew ever-increasing amounts of carbon dioxide into the atmosphere as the climate continues to warm. The new simulations suggest that if microbial efficiency declines in a warmer world, carbon dioxide emissions will fall back to pre-warming levels, a pattern seen in field experiments. But if microbes manage to adapt to the warmth – for instance, through increased enzyme activity – emissions could intensify.

“When we developed a model based on the actual biology of soil microbes, we found that soil carbon may not be lost to the atmosphere as the climate warms,” said Matthew Wallenstein of the Natural Resource Ecology Laboratory at Colorado State University. “Conventional ecosystem models that didn’t include enzymes did not make the same predictions.”

Mark Bradford, assistant professor of terrestrial ecosystem ecology at Yale, said there is intense debate in the scientific community over whether the loss of soil carbon will contribute to global warming. “The challenge we have in predicting this is that the microbial processes causing this loss are poorly understood,” he said. “More research in this area will help reduce uncertainties in climate prediction.”


http://www.iup.uni-heidelberg.de/institut/forschung/groups/kk/en/CO2_html

Ruprecht-Karls-Universität Heidelberg
Institute of Environmental Physics
Global Atmospheric Carbon Dioxide Cycle

The mean residence time of carbon dioxide in the atmosphere is in the order of only 3-4 years. Accordingly, about 25-30% of the atmospheric CO2 inventory of today about 795 PgC (1 PgC = 1015 gC) are annually exchanged with the biosphere (ca. 120 PgC/yr) and the ocean surface waters (ca. 76 PgC/yr, Naegler,2009). Compared to this large gross exchange of carbon between reservoirs, the total yearly net perturbation fluxes are smaller by almost two orders of magnitude: In the last 5 years, the input of CO2 into the atmosphere from burning of fossil fuels and cement production summed up to about 7 PgC/yr, and, in addition, about 2 PgC/yr were released in the course of deforestation and land use change. Although the effect of these emissions on the atmospheric CO2 concentration is clearly observed and well documented, it sums up to a mean increase of only 4 PgC/yr in the atmospheric burden during the last decades. The remaining fraction is buffered away about equally by the world oceans and the biosphere. This partitioning of anthropogenic CO2 between buffer reservoirs is determined by the dynamics of their internal mixing as well as by the strength of their gross carbon exchange with the atmosphere and leads to a residence time of excess man-made CO2 in the atmosphere as large as several hundred years. Despite intensive research in the last decades, the uncertainty of the gross exchange rates between carbon reservoirs is still in the order of ±20%. It thus remains difficult to univocally quantify the repartition of net uptake between the biosphere and the oceans, and thus, to predict the fate of anthropogenic CO2 emissions. The situation is further complicated by the fact that the share of excess CO2 taken up by the biosphere and oceans varies from year to year and will further change in the near future under possibly changing climatic conditions. This concerns in particular the terrestrial biospheric reservoir, which has only a small carbon inventory (about 2000 PgC) compared with the oceans (38,000 PgC). Moreover, this reservoir consists of living plants and dead soil organic matter, which are highly vulnerable and already today strongly perturbed by human activity.


CarbonCycleSketch2009.jpg
 
Testimony of The Viscount Monckton of Brenchley
Before Congress, 6 May 2010


The Select Committee, in its letter inviting testimony for the present hearing, cites various scientific bodies as having concluded that
1. The global climate has warmed;
2. Human activities account for most of the warming since the mid-20th century;
3. Climate change is already causing a broad range of impacts in the United States;
4. The impacts of climate change are expected to grow in the coming decades.

The first statement requires heavy qualification and, since the second is wrong, the third and fourth are without foundation and must fall. The Select Committee has requested answers to the following questions:

1. What are the observed changes to the climate system?​

Carbon dioxide concentration: In the Neoproterozoic Era, ~750 million years ago, dolomitic rocks, containing ~40% CO2 bonded not only with calcium ions but also with magnesium, were precipitated from the oceans worldwide by a reaction that could not have occurred unless the atmospheric concentration of CO2 had been ~300,000 parts per million by volume. Yet in that era equatorial glaciers came and went twice at sea level.

Today, the concentration is ~773 times less, at ~388 ppmv: yet there are no equatorial glaciers at sea level. If the warming effect of CO2 were anything like as great as the vested-interest groups now seek to maintain, then, even after allowing for greater surface albedo and 5% less solar radiation, those glaciers could not possibly have existed (personal communication from Professor Ian Plimer, confirmed by on-site inspection of dolomitic and tillite deposits at Arkaroola Northern Flinders Ranges, South Australia).

In the Cambrian Era, ~550 million years ago, limestones, containing some 44% CO2 bonded with calcium ions, were precipitated from the oceans. At that time, atmospheric CO2 concentration was ~7000 ppmv, or ~18 times today’s (IPCC, 2001): yet it was at that time that the calcite corals first achieved algal symbiosis. In the Jurassic era, ~175 million years ago, atmospheric CO2 concentration was ~6000 ppmv, or ~15 times today’s (IPCC, 2001): yet it was then that the delicate aragonite corals came into being.

Therefore, today’s CO2 concentration, though perhaps the highest in 20 million years, is by no means exceptional or damaging. Indeed, it has been argued that trees and plants have been part-starved of CO2 throughout that period (Senate testimony of Professor Will Happer, Princeton University, 2009). It is also known that a doubling of today’s CO2 concentration, projected to occur later this century (IPCC, 2007), would increase the yield of some staple crops by up to 40% (lecture by Dr. Leighton Steward, Parliament Chamber, Copenhagen, December 2009).

Global mean surface temperature: Throughout most of the past 550 million years, global temperatures were ~7 K (13 F) warmer than the present. In each of the past four interglacial warm periods over the past 650,000 years, temperatures were warmer than the present by several degrees (A.A. Gore, An Inconvenient Truth, 2006).

In the current or Holocene warm period, which began 11,400 years ago at the abrupt termination of the Younger Dryas cooling event, some 7500 years were warmer than the present (Cuffey & Clow, 1997), and, in particular, the medieval, Roman, Minoan, and Holocene Climate Optima were warmer than the present (Cuffey & Clow, 1997). The “global warming” that ceased late in 2001 (since when there has been a global cooling trend for eight full years) had begun in 1695, towards the end of the Maunder Minimum, a period of 70 years from 1645-1715 when the Sun was less active than at any time in the past 11,400 years (Hathaway, 2004). Solar activity increased with a rapidity unprecedented in the Holocene, reaching a Grand Solar Maximum during a period of 70 years from 1925-1995 when the Sun was very nearly as active as it had been at any time in the past 11,400 years (Hathaway, 2004; Usoskin, 2003; Solanki, 2005).

The first instrumental record of global temperatures was kept in Central England from 1659. From 1695-1735, a period of 40 years preceding the onset of the Industrial Revolution in 1750, temperatures in central England, which are a respectable proxy for global temperatures, rose by 2.2 K (4 F). Yet global temperatures have risen by only 0.65 K (1.2 F) since 1950, and 0.7 K (1.3 F) in the whole of the 20th century. Throughout the 21st century, global temperatures have followed a declining trend.

Accordingly, neither global mean surface temperature nor its rates of change in recent decades have been exceptional, unusual, inexplicable, or unprecedented.

Ocean “acidification”: It has been suggested that the oceans have “acidified” - or, more correctly, become less alkaline - by 0.1 acid-base units in recent decades. However, the fact of a movement towards neutrality in ocean chemistry, if such a movement has occurred, tells us nothing of the cause, which cannot be attributed to increases in CO2 concentration. There is 70 times as much CO2 dissolved in the oceans as there is in the atmosphere, and some 30% of any CO2 we add to the atmosphere will eventually dissolve into the oceans. Accordingly, a doubling of CO2 concentration, expected later this century, would raise the oceanic partial pressure of CO2 by 30% of one-seventieth of what is already there. And that is an increase of 0.4% at most. Even this minuscule and chemically-irrelevant perturbation is probably overstated, since any “global warming” that resulted from the doubling of CO2 concentration would warm the oceans and cause them to outgas CO2, reducing the oceanic partial pressure.

Seawater is a highly buffered solution - it can take up a huge amount of dissolved inorganic carbon without significant effect on pH. There is not the slightest possibility that the oceans could approach the neutral pH of pure water (pH 7.0), even if all the fossil fuel reserves in the world were burned. A change in pH of 0.2 units this century, from its present 8.2 to 8.0, even if it were possible, would leave the sea containing no more than 10% of the “acidic” positively-charged hydrogen ions that occur in pure water. If ocean “acidification” is happening, then CO2 is not and will not be the culprit.

2. What evidence provides attribution of these changes to human activities?

In the global instrumental record, which commenced in 1850, the three supradecadal periods of most rapid warming were 1860-1880, 1910-1940, and 1975-2001. Warming rates in all three periods were identical at ~0.16 K (0.3 F) per decade. During the first two of these three periods, observations were insufficient to establish the causes of the warming: however, the principal cause cannot have been atmospheric CO2 enrichment, because, on any view, mankind’s emissions of CO2 had not increased enough to cause any measurable warming on a global scale during those short periods.

In fact, the third period of rapid global warming, 1975-2001, was the only period of warming since 1950. From 1950-1975, and again from 2001-2010, global temperatures fell slightly (HadCRUTv3, cited in IPCC, 2007). What, then, caused the third period of warming? Most of that third and most recent
period of rapid warming fell within the satellite era, and the satellites confirmed measurements from ground stations showing a considerable, and naturally-occurring, global brightening from 1983-2001 (Pinker et al., 2005).

Allowing for the fact that Dr. Pinker’s result depended in part on the datasets of outgoing radiative flux from the ERBE satellite that had not been corrected at that time for orbital decay, it is possible to infer a net increase in surface radiative flux amounting to 0.106 Wm2year over the period, compared with the 0.16 W m-2 year-1 found by Dr. Pinker. Elementary radiative-transfer calculations demonstrate that a natural surface global brightening amounting to ~1.9 W m-2 over the 18-year period of study would be expected - using the IPCC’s own methodology - to have caused a transient warming of 1K (1.8 F). To put this naturally-occurring global brightening into perspective, the IPCC’s estimated total of all the anthropogenic influences on climate combined in the 256 years 1750-2005 is only 1.6 W m-2. Taking into account a further projected warming, using IPCC methods, of ~0.5 K (0.9F) from CO2 and other anthropogenic sources, projected warming of 1.5 K (2.7 F) should have occurred.

However, only a quarter of this projected warming was observed, suggesting the possibility that the IPCC may have overestimated the warming effect of greenhouse gases fourfold. This result is in line with similar result obtained by other methods: for instance, Lindzen & Choi (2009, 2010 submitted) find that the warming rate to be expected as a result of anthropogenic activities is one-quarter to one-fifth of the IPCC’s central estimate. There is no consensus on how much warming a given increase in CO2 will cause.

3. Assuming ad argumentum that the IPCC’s projections of future warming are correct, what policy measures should be taken?​

Warming at the very much reduced rate that measured (as opposed to merely modeled) results suggest would be 0.7-0.8 K (1.3-1.4 F) at CO2 doubling. That would be harmless and beneficial - a doubling of CO2 concentration would increase yields of some staple crops by 40%. Therefore, one need not anticipate any significant adverse impact from CO2-induced “global warming”. “Global warming” is a non-problem, and the correct policy response to a non-problem is to have the courage to do nothing.

However, ad argumentum, let us assume that the IPCC is correct in finding that a warming of 3.26 plus/minus 0.69 K (5.9 plus/minus 1.2 F: IPCC, 2007, ch.10, box 10.2) might occur at CO2 doubling. We generalize this central prediction, deriving a simple equation to tell us how much warming the IPCC would predict for any given change in CO2 concentration -

ΔTS ≈ (8.5 ± 1.8) ln(C/Co) F.​

Thus, the change in surface temperature in Fahrenheit degrees, as predicted by the IPCC, would be 6.7 to 10.3 (with a central estimate of 8.5) times the logarithm of the proportionate increase in CO2 concentration. We check the equation by using it to work out the warming the IPCC would predict at CO2 doubling: 8.5 ln 2 ≈ 5.9 F. Using this equation, we can determine just how much “global warming” would be forestalled if the entire world were to shut down its economies and emit no carbon dioxide at all for an entire year. The atmospheric concentration of CO2 is 388 parts per million by volume. Our emissions of 30 bn tons of CO2 a year are causing this concentration to rise at 2 ppmv/year, and this ratio of 15 bn tons of emissions to each additional ppmv of CO2 concentration has remained constant for 30 years.

Then the “global warming” that we might forestall if we shut down the entire global carbon economy for a full year would be 8.5 ln[(388+2)/388] = 0.044 F. At that rate, almost a quarter of a century of global zero-carbon activity would be needed in order to forestall just one Fahrenheit degree of “global warming”. Two conclusions ineluctably follow. First, it would be orders of magnitude more cost effective to adapt to any “global warming” that might occur than to try to prevent it from occurring by trying to tax or regulate emissions of carbon dioxide in any way.

Secondly, there is no hurry. Even after 23 years doing nothing to address the imagined problem, and even if the IPCC has not exaggerated CO2’s warming effect fourfold, the world will be just 1 F warmer than it is today. If the IPCC has exaggerated fourfold, the world can do nothing for almost a century before global temperature rises by 1 F. There are many urgent priorities that need the attention of Congress, and it is not for me as an invited guest in your country to say what they are. Yet I can say this much: on any view, “global warming” is not one of them.


Climate Actually Changes! Film at 11:00!

By Willis Eschenbach

Last month (April 2010), the US Environmental Protection Agency (EPA) put out a study called “Climate Change Indicators in the United States” (13 Mb PDF). I read through it … depressingly bad science.

To start with, they parrot the findings of the IPCC as their “evidence” that everything we see in the climate record is human-caused. They say:
The buildup of green- house gases in the atmosphere is very likely the cause of most of the recent observed increase in average temperatures, and contributes to other climate changes. (IPCC 2007)

Despite the “very likely” certainty of the IPCC, I see the current level of our knowledge of the Earth’s climate a bit differently, as shown in Figure 1:

current_state_climate_knowledge.jpg

Figure 1. Graph showing our understanding of the climate. Image is the painting by J. M. W. Turner, “Rain, Steam and Speed – The Great Western Railway”.

Having asserted that all changes are due to humans, they then list a bunch of changes, and consider their case as being established. Here’s how they put it:
The indicators in this report present clear evidence that the composition of the atmosphere is being altered as a result of human activities and that the climate is changing. They also illustrate a number of effects on society and ecosystems related to these changes.​

Now, that particular statement is very carefully crafted. It is very painstakingly worded so that no one can say that they claimed the changes in climate are caused by the changes in the “composition of the atmosphere” … but heck, if you mistakenly were to assume that, the EPA won’t get in your way.

In other words, CO2 is rising and climate is changing … stunning news.

But that’s just the start. The individual parts of the report are marked by plain old bad science.

Here’s one example among many. This is the record of “heat waves”, which they define as follows:

While there is no universal definition of a heat wave, this indicator defines a heat wave as a four-day period with an average temperature that would only be expected to occur once every 10 years, based on the historical record.

This indicator reviews trends in the U.S. Annual Heat Wave Index between 1895 and 2008. This index tracks the frequency of heat waves across the lower 48 states, but not the intensity of these episodes. The index uses daily maximum temperature data from the National Oceanic and Atmospheric Administration, which keeps records from weather stations throughout the nation. Approximately 300 to 400 stations reported data from 1895 to 1910; over the last 100 years, the number of stations has risen to 700 or more.

The index value for a given year could mean several different things. For example, an index value of 0.2 in any given year could mean that 20 percent of the recording stations experienced one heat wave; 10 percent of stations experienced two heat waves; or some other combination of stations and episodes resulted in this value.​

Sadly, although they say they use NOAA data, they don’t say where the data that they used is located. Well, no, actually that’s not quite true. They say:

The data for this indicator are based on measurements from the National Oceanic and Atmospheric Administration’s National Weather Service Cooperative Observer Network. These weather station data are available online at: www.nws.noaa.gov/os/coop/what-is-coop.html.​

Unfortunately, when you go to that URL, there’s no data. There’s just a description of the Cooperative Station Program entitled “What is the Coop Program?” … but I digress …

Regarding heat waves, they say:

The frequency of heat waves in the United States decreased in the 1960s and 1970s, but has risen steadily since then. The percentage of the United States experiencing heat waves has also increased. The most severe heat waves in U.S. history remain those that occurred during the “Dust Bowl” in the 1930s, although average temperatures have increased since then.​

Having said that, Figure 2 shows their data for the Heat Wave Index, the linear trend over the entire period, and the change in atmospheric CO2 during the period.

us_annual_heat_wave_index.jpg

Figure 2. “Heat Wave Index” (yellow line) and CO2 level (red line, right scale). Orange line is the linear trend for the entire period.

You’d think that the only reasonable conclusions from this chart would be that heat waves and CO2 are not related in the slightest, that there is no overall change in the US Heat Wave Index, and that there appears to have been a step change in the data in 1980 … but this being the EPA, you’d be wrong. This is all part of the ‘CO2 is rising and climate is changing’ mantra.

And you would also think that they would give us drought information to go with this...

... But strangely, rather than report that drought is no more common now than a hundred years ago, they say:

During the 20th century, many indices were created to measure drought severity by looking at trends in precipitation, soil moisture, stream flow, vegetation health, and other variables. This indicator is based on the U.S. Drought Monitor, which integrates several of these indices.​

Why is the U.S. Drought Monitor a strange choice for their analysis? Well, because that particular drought indicator only contains data that goes all the way back to … 2000. Not even one decade of data. And of course, their conclusion is:

Because data from the U.S. Drought Monitor are only available for the most recent decade, there is no clear long-term trend in this indicator.​

Well, duh … the USHCN maintains several long-term drought indicators which cover the period 1895 – present, so the EPA chose to only report on an indicator with a nine-year record, and then explains that the record is too short to show a trend.

I could give you many more examples, but my stomach won’t take it. This is the US EPA, however, so I suppose I shouldn’t be surprised. My tax dollars at work …
 
Last edited:
I hope I'm doing this right, cause I found this a pretty funny article.


http://news.discovery.com/human/warming-human-temperature.html
-~- Sidney, New South Wales, Australia -~-

A large number of healthy people won't handle the heat if temperatures continue to increase into next century, predict researchers.

The study, which appears in the recent issue of Proceedings of the National Academy of Sciences, also suggests heat could affect more land mass than rising sea levels.

The human body maintains a constant core temperature of 98.6 degrees F (37 degrees C) by giving off excess heat through the skin. But, if the "web-bulb" temperature of the air reaches 95 degrees F (35 degrees C), this heat dissipation stops, causing the body to retain heat, resulting in heat stress.

Wet-bulb temperature is measured using a thermometer wrapped in a wet, porous material. It is typically less than "dry-bulb" temperature and is used to calculate humidity.

Steven Sherwood of University of New South Wales and Matthew Huber of Purdue University in Illinois, used climate models to predict where and when temperatures will increase to uncomfortable levels.

They found a global temperature increase of 10.8 degrees F (7 degrees C) above pre-industrial levels would push temperatures in some regions above 95 degrees F for extended periods, resulting in heat stress across the whole population. Sherwood said while heat-related deaths among the elderly and young already occur, global warming will result in more of the population suffering.

"What we're talking about here is something a bit different -- these limits apply to a healthy person," he said.

The study highlights a number of potential "hot spots" in the future.

"The places that heat stress will be highest are places near sea level and at lower latitudes and that's where people live," said Sherwood. "This includes Amazonia; most of China; India; Indonesia; pretty much all of South East Asia; eastern United States; northern Australia and parts of Africa."

Sherwood said populations faced with heat stress have two options -- relocate to a cooler climate or rely on air conditioning.

"Right now we have air conditioning for comfort," he said. "Under these circumstances you would be using it for survival."

The study also mentions the impact higher temperatures will have on livestock.

"You wouldn't be able to raise the usual levels of livestock unless you have them living in giant air conditioned domes," Sherwood said.

While the Earth has experienced similar levels of warming in the past, Sherwood said it is currently occurring on a much faster scale.

"The last warm period lasted for many millions of years and came on gradually," he said. "[Current warming] is not coming on gradually. Compared to other climates of this type it's more explosive."

Sherwood said a 10.8 degree F (7 degree C) increase isn't likely to happen until next century, but he said it's important to understand the impact should it occur.

"When you're planning sensibly for anything you plan for the worst case scenario," he said. "We're saying this is the worst scenario, we're not saying it's going to happen soon, but to ignore it seems foolhardy."

The researchers conclude further warming would have a more drastic impact.

"If warmings of 10.8 degrees F (10 degrees C) were really to occur in [the] next three centuries, the area of land likely rendered uninhabitable by heat stress would dwarf that effect by rising sea level," they write.

The average global temperature has increased by 1.4 degrees F (0.8 degrees C) since pre-industrial times. Some scientists and environmental groups are pushing for limits on human-produced greenhouse gas emissions to limit the increase to no more than 3.6 degrees F (2 degrees C).
 

Here are two statements that are completely agreed on by the IPCC. It is crucial to be aware of these facts and of their implications.

1. A doubling of CO2, by itself, contributes only about 1C to greenhouse warming. All models project more warming, because, within models, there are positive feedbacks from water vapor and clouds, and these feedbacks are considered by the IPCC to be uncertain.

2. If one assumes all warming over the past century is due to anthropogenic greenhouse forcing, then the derived sensitivity of the climate to a doubling of CO2 is less than 1C. The higher sensitivity of existing models is made consistent with observed warming by invoking unknown additional negative forcings from aerosols and solar variability as arbitrary adjustments.


Given the above, the notion that alarming warming is ‘settled science’ should be offensive to any sentient individual, though to be sure, the above is hardly emphasized by the IPCC.


Richard Lindzen, Ph.D.
Alfred P. Sloan Professor of Meteorology
Massachusetts Institute of Technology
Fellow, American Academy of Arts and Sciences, AGU, AAAS, and AMS
Member Norwegian Academy of Science and Letters
Member National Academy of Sciences


See:
http://royalsociety.org/climate-change/


Royal Society to review climate message

21:32 GMT, Thursday, 27 May 2010 22:32 UK
By Roger Harrabin
Environment analyst, BBC News


The UK's Royal Society is reviewing its public statements on climate change after 43 Fellows complained that it had oversimplified its messages.

They said the communications did not properly distinguish between what was widely agreed on climate science and what is not fully understood...


...One Fellow who said he was not absolutely convinced of the dangers of CO2 told me: “This appears to suggest that anyone who questions climate science is malicious. But in science everything is there to be questioned – that should be the very essence of the Royal Society. Some of us were very upset about that.

“I can understand why this has happened – there is so much politically and economically riding on climate science that the society would find it very hard to say ‘well, we are still fairly sure that greenhouse gases are changing the climate’ but the politicians simply wouldn’t accept that level of honest doubt.”

Another society protester said he wanted to be called a climate agnostic rather than a sceptic. He said he wanted the society’s website to “do more to question the accuracy of the science on climate feedbacks” (in which a warming world is believed to make itself warmer still through natural processes).

“We sent an e-mail round our friends, mainly in physical sciences,” he said.

“Then when we had got 43 names we approached the council in January asking for the website entry on climate to be re-written. I don’t think they were very pleased. I don’t think this sort of thing has been done before in the history of the society.

“But we won the day, and the work is underway to re-write it. I am very hopeful that we will find a form of words on which we can agree.

“I know it looks like a tiny fraction of the total membership (1,314) but remember we only emailed our friends – we didn’t raise a general petition.”


http://news.bbc.co.uk/2/hi/science_and_environment/10178124.stm
 
Last edited:
Back
Top