The Nobel Prize (for propaganda)


The proponents of the hypothesis of anthropogenic global warming have a very simple problem: NO SCIENCE.

What have the proponents of the hypothesis of AGW brought to the table thus far? They have asserted that current temperatures are "unprecedented." That simply isn't true. They have asserted a positive feedback between levels of carbon dioxide and GATA but have not demonstrated any such relationship. In fact, the historic record ( to the extent one accepts the proxy temperatures and CO2 levels from the Vostok ice cores ) show precisely the opposite: global temperatures appear to lead/cause/determine CO2 levels.

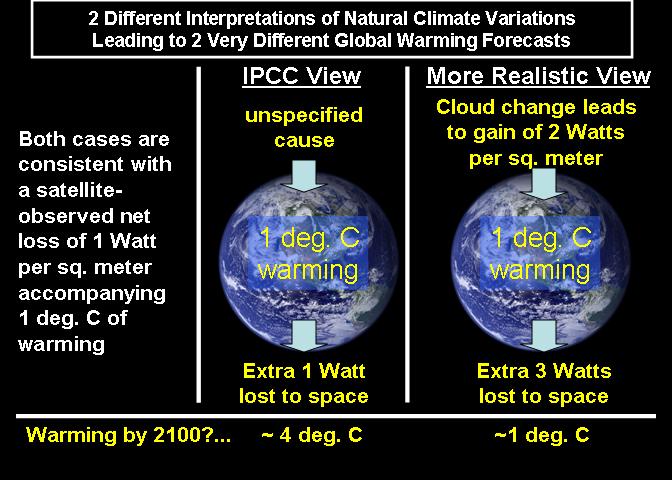
Promoters of the AGW hypothesis ask the world to accept computer models incorporating the simultaneous solution of multiple dozens of non-linear differential equations as "proof" of humanity's comprehension of an impossibly complex climate system— the same models that have no demonstrable record of accuracy.

That's it; that is the sum total of the "proof" offered up by the proponents of the hypothesis. The problem remains; it is quite simple— there is NO OBSERVABLE, REPEATABLE, VERIFIABLE, REPRODUCIBLE SCIENCE behind the hypothesis.

science_method.png


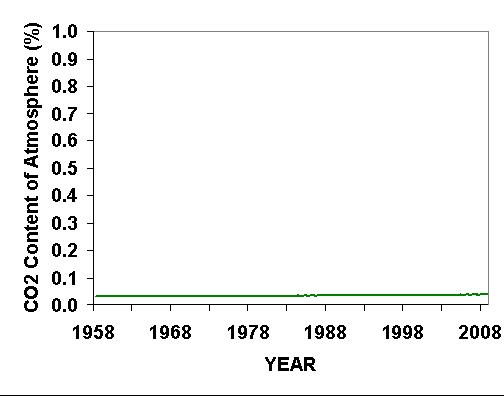
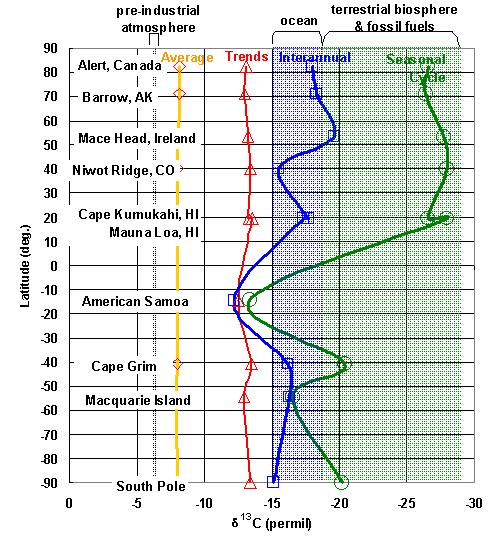
The IPCC report states atmospherice lifetime of CO2) is 50-200 years (without defining the term 'lifetime'--it assumed this means residence time). The article rightly uses C12, C13, C14 isotopic ratios though not in much detail. Radon (Rn222) is also a proxy. Although there is disagreement on on the exact residence time in the scientific community (probably due to different variables), mass balance equations using isotopic ratios have a range is 3-25 years!!! THIS MEANS THERES A TOTAL TURNOVER OF CARBON EVERY 25 YEARS AT A MAXIMUM. I've cited 5 years in an earlier post and here is an article that corroborates this number http://www.greenworldtrust.org.uk/Science/Scientific/Segalstad.htm (see section 9) which means total atmospheric CO2 contributed by fossil fuels is 1.2%. The IPCC reports state it's 21%. In order to acheive 21%, with a residence time of 5 years, the CO2 resevoir would have to be 5 times larger than the atmosphere itself (Broeker et al., 1979: Fate of fossil fuel, carbon dioxide and the global carbon balance. Science, 206: 409-418.)

This is the single-most lucid and readable explanation of the science I've ever stumbled upon. If you read nothing else, read this:
http://www.middlebury.net/op-ed/global-warming-01.html
by James A. Peden


I think it's pretty goddamn funny that the odds are I am one of the lowest consumers ( if not the outright least consumer ) of gasoline of anybody on this entire thread ( and probably whole website ).

My "carbon footprint" is essentially nonexistant. Yanno why? It's 'cause I'm a tightwad and I walk everywhere I possibly can.

~~~~~~~~~~~~~~~~~
2005 gasoline expenditure
$230.99
2005 gasoline consumption
99.8 gallons
Average cost/gallon
$2.31
2005 total mileage
3,012 miles
~~~~~~~~~~~~~~~~~
2006 gasoline expenditure
$272.37
2006 gasoline consumption
97.9 gallons
Average cost/gallon
$2.78
2006 total mileage
2,992 miles
~~~~~~~~~~~~~~~~~
2007 gasoline expenditure
$189.23
2007 gasoline consumption
67.6 gallons
Average cost/gallon
$2.80
2007 total mileage
1,959 miles
~~~~~~~~~~~~~~~~~
2008 gasoline expenditure
$203.28
2008 gasoline consumption
53.3 gallons
Average cost/gallon
$3.81
2008 total mileage
1,522 miles
~~~~~~~~~~~~~~~~~
2009 gasoline expenditure
$137.83
2009 gasoline consumption
54.6 gallons
Average cost/gallon
$2.53
2009 total mileage
1,567 miles


You're also extremely anal-retentive if you keep that sort of worthless data updated yearly. :D
 
I'll be quite honest. I don't know what all the evidence is. And neither do you. Isotope ratios, fossil distributions, core samples, paleopollenography, thermodynamic data, all sorts of stuff, I suppose. I'm sure much of the evidence is ambiguous, or paradoxical, or misinterpreted or misunderstood. Because that too is a part of science, a part we don't like to talk about when we talk about our ideal systems.

I don't know what all the evidence is because I'm not a professional climatologist or atmospheric scientist working on this problem. But when I truly want to know what's happening with the climate and the atmosphere, I don't start googling for myself, because the field is too vast and I'm not an expert and I know how much bullshit is flying around. I go to the most credible, reputable, knowledgeable sources and get their opinion, and when I do that, I find that every scientific organization on the planet has come out squarely behind anthropogenic global warming and none of them have come out against it, and that impresses me.

Now, as you say, I don't know what all the evidence is. But they do. They've seen all the evidence and weighed it and analyzed it and taken into account the anomalies and paradoxes (which, I assure you, are not news to them). They know how science works and don't need any flow charts to remind them. They've taken all this into consideration and they're convinced. They endorse the findings of AGW. They've staked their reputations on it, which is a lot more than they did with Piltdown man or Cold Fusion.

You may think they're part of some fad or mass hysteria or delusion. You may pick and niggle at the edges of their research, finding an inconsistency here, some bad data there, you may find the occasional rogue scientist or "paid consultant" to denounce AGW or sign some carefully worded statement about the predictions being "uncertain" (well of course they're "uncertain"!) or "unscientific". But until you get some major world-class scientific organizations to endorse the anti-AGW point of view, the matter is closed as far as I'm concerned. The phenomenon is real.

I'm a layman. I will always be a layman in this area, and you will be too. My choice is for whom to believe. The most prestigious scientific organizations in the world, or Trysail.

You'll excuse me, Trysail.


It's time for a little humor:

On the political front, and to be filed under the heading 'You Can't Make This Stuff Up,' the Copenhagen climate summit is in full swing and the delegates are leaving a 'footprint' bigger than 'Sasquatch' if we are to believe the reports there. The Telegraph in London reports that a record number of limousines have been deployed to and will be used in Copenhagen this week by the delegates to the convention. Those in the business of leasing limousines in the city were expecting an increase in demand of course, but the increase has gone beyond their wildest imagination. The head of one company had expected that perhaps 200 limousines would be needed this week, up from Copenhagen's regular demand for perhaps 50 on any given day. However, the demand has risen to more than 1,200, and as one company owner said
We haven't got enough limos in the country to fulfill the demand [so]... we're having to drive them in hundreds of miles from Germany and Sweden.

When asked how many of the delegates had asked for a 'hybrid' fuel driven limousine, the same company owner said
Five. The government has some alternative fuel cars but the rest will be petrol or diesel. We don't have any hybrids in Denmark, unfortunately, due to the extreme taxes on those cars. It makes no sense at all, but it's very Danish.

So in two swift statements, this limousine company owner has exposed the utter and complete hypocrisy of the climate change crowd and has exposed the idiocy of Danish taxation, and has given us a good laugh at the expense of the climate changers.

Further, and leaving even bigger carbon footprints, we are told that the local airport is expecting 140 extra private jets during the peak period of landings and take-offs. This is so far above the airport's capacity that the planes are being diverted to other regional airports, requiring that the limousines drive much farther than had been expected to pick up their passengers and transport them back to Copenhagen. Which will then, of course, require that they be ferried back to these same regional airports in the same fuel using limousines when the passengers/delegates in question fly home. You can't make this stuff up. You just can't! Sometimes it's just too easy.


... and some more ( humor, that is ):

To The Secretary of State,
Department for Environment, Food, Rural Affairs and Global Warming (DEFRAGLOBWARG)
QashQau House, Smith Square, London, SW1H 0AX

Dear Secretary of State,

My friend, who is in farming at the moment, recently received a check for £3,000 from the Rural Payments Agency for not rearing pigs. I would now like to join the “not rearing pigs” business.

In your opinion, what is the best kind of farm not to rear pigs on, and which is the best breed of pigs not to rear? I want to be sure I approach this endeavor in keeping with all government policies, as dictated by the EU under the Common Agricultural Policy.

I would prefer not to rear bacon pigs, but if this is not the type you want not rearing, I will just as gladly not rear porkers. Are there any advantages in not rearing rare breeds such as Saddlebacks or Gloucester Old Spots, or are there too many people already not rearing these?

As I see it, the hardest part of this program will be keeping an accurate record of how many pigs I haven’t reared. Are there any Government or Local Authority courses on this?

My friend is very satisfied with this business. He has been rearing pigs for forty years or so, and the best he ever made on them was £1,422 in 1968. That is – until this year, when he received a check for not rearing any.

If I get £3,000 for not rearing 50 pigs, will I get £6,000 for not rearing 100? I plan to operate on a small scale at first, holding myself down to about 4,000 pigs not raised, which will mean about £240,000 for the first year. As I become more expert in not rearing pigs, I plan to be more ambitious, perhaps increasing to, say, 40,000 pigs not reared in my second year, for which I should expect about £2.4 million from your department.

Incidentally, I wonder if I would be eligible to receive tradable carbon credits for all these pigs not producing harmful and polluting methane gases?

Another point: These pigs that I plan not to rear will not eat 2,000 tons of cereals. I understand that you also pay farmers for not growing crops. Will I qualify for payments for not growing cereals to not feed the pigs I don’t rear?

I am also considering the “not milking cows” business, so please send any information you have on that too. Please could you also include the current Defraglobwarg advice on untilled fields? Can this be done on an e-commerce basis with virtual fields (of which I seem to have several thousand acres)?

In view of the above you will realise that I will be totally unemployed, and will therefore qualify for unemployment benefits. I shall of course be voting for your party at the next general election.

Yours faithfully,
Nigel Johnson-Hill
 
The Telegraph in London reports that a record number of limousines have been deployed to and will be used in Copenhagen this week by the delegates to the convention.

Do your Wall Street buddies receive the same scrutiny as the Copenhagen delegates, or do they get a free pass because they don't believe in GW? How about all those rich CEO's living in huge McMansions, wasting untold amounts of energy heating and cooling their oversized homes? Do they receive the same scrutiny, or are they exempt because they "earned" the right to over-consume by virtue of the free market system? I mean, really Trysail, if you're going to single out one group for being wasteful, while ignoring the rest, it reveals a bias that reflects poorly on your objectivity.
 
Do your Wall Street buddies receive the same scrutiny as the Copenhagen delegates, or do they get a free pass because they don't believe in GW? How about all those rich CEO's living in huge McMansions,
wasting untold amounts of energy heating and cooling their oversized homes? Do they receive the same scrutiny, or are they exempt because they "earned" the right to over-consume by virtue of the free market system?
I mean, really Trysail, if you're going to single out one group for being wasteful, while ignoring the rest, it reveals a bias that reflects poorly on your objectivity.


Why would you assume I have "Wall Street buddies?" I've got more enemies on "Wall Street" than you can count. ( By the way, you are obviously unaware of the fact that "Wall Street" is positively salivating over the possible adoption of "cap and trade." It would represent a gargantuan bonanza for the likes of Goldman Sachs, JP Morgan, ABN Amro, Deutsche Bank et al ).

Where did you acquire your envy and jealousy? It's amazing; I don't believe I've ever seen anyone so consumed by envy and jealousy as you obviously are.


By the way, you've never responded to the question I've repeatedly asked of you: What's your opinion of George Harrison, John Williams, Bono, Steven Spielberg, Mick Jagger, Barbra Streisand, Paul McCartney, Pete Townsend, Tom Hanks, Carlos Santana, David Byrne, Andrew Lloyd Webber, James Levine, Steve Martin, Luciano Pavarotti, Robert DiNiro, John Travolta, Jim Carrey et al? Do you think there's any
wasting untold amounts of energy heating and cooling their oversized homes? Do they receive the same scrutiny, or are they exempt because they "earned" the right to over-consume by virtue of the free market system?
going on there?


Atmospheric CO2:
mauna-loa-co2-1-percent-scale.jpg

P.S., would you be so kind as to define the words oversized and over-consume? When you become dictator, the rest of us will obviously need to know in order to avoid execution. Also, kindly note that I have ( thus far ) studiously avoided mentioning the notorious ( and self-confirmed ) energy consumption of the Tennessee abode of a certain former Vice-President ( http://www.snopes.com/politics/business/gorehome.asp , if you're interested ).


Last edited:
Where did you acquire your envy and jealousy? It's amazing; I don't believe I've ever seen anyone so consumed by envy and jealousy as you obviously are.

Envy? Jealousy? You'll have to explain. Disgust would be a better description. I am not envious of people who move money around for a living. Quite the contrary. I think they're the lowest form of parasite, benefiting from the hard work of others while contributing nothing to society. Your association with the financial world, your opposition to taxes, and your GW denier status automatically places you in this category. In that respect, I may be guilty of applying a stereotype to your purpose in the world, but all I have to go on is your posting persona, so if I've misconstrued your motives, that's your fault, not mine.

By the way, you've never responded to the question I've repeatedly asked of you: What's your opinion of George Harrison, John Williams, Bono, Steven Spielberg, Mick Jagger, Barbra Streisand, Paul McCartney, Pete Townsend, Tom Hanks, Carlos Santana, David Byrne, Andrew Lloyd Webber, James Levine, Steve Martin, Luciano Pavarotti, Robert DiNiro, John Travolta, Jim Carrey et al? Do you think there's any [/b][/font][/color][/size]
wasting untold amounts of energy heating and cooling their oversized homes? Do they receive the same scrutiny, or are they exempt because they "earned" the right to over-consume by virtue of the free market system?
going on there?


Anyone who expends more energy than they need is contributing to the GW problem. That's why I brought up the issue of the fat cats working the free market system and pissing away their ill-gotten gains on wasted energy consumption. You singled out the Copenhagen delegates, I simple pointed out that they're no different from anyone else who has become financial successful, and therefore, somehow, immune from considering the affect of their actions on the rest of humanity. Considering your apparent support for free market capitalism, and your objection to considering the affects of energy use on the environment, it seemed highly hypocritical of you to point out the energy use of the delegates in Copenhagen. If you want to play on both sides of the fence, that's your choice, but it reflects poorly on your credibility.

P.S., would you be so kind as to define the words oversized and over-consume? When you become dictator, the rest of us will obviously need to know in order to avoid execution. Also, kindly note that I have ( thus far ) studiously avoided mentioning the notorious ( and self-confirmed ) energy consumption of the Tennessee abode of a certain former Vice-President ( http://www.snopes.com/politics/business/gorehome.asp , if you're interested ).

See above for the definition of "over-consume". No one is talking about being a dictator (except you). What I would like to see is a heightened awareness of wasteful energy use. As it is now, we take energy for granted. That's going to have to change, at least if we're interested in the survival of mankind on this planet. I would compare energy awareness to the social shift on the ill affects of smoking. It took a while, but eventually, people realized that smoking was bad for them. It appears as though it's going to take even longer for people to realize that over-consumption of energy is also bad for them, or more specifically, bad for their offspring.

Regarding Al Gore, this is the latest info on energy use at the Gore residence, from factcheck.org. According to the info there, he has made significant changes since 2007, when his energy use first came to light. Another consideration - both he and his wife are running businesses out of their home, which would put them in a different category, if one wanted to get anal about it, (and we all know how anal you can be - at least about some things.)

Kreider, June 16: The Gores’ home is certified by the US Green Building Council as a Gold LEED certified home for retrofitted homes. As part of the LEED certification process, they upgraded their windows, lighting, appliances and insulation, among other items in and around the home [...] The residence is powered with a geothermal system as well as 33-solar panels. The Gores also participate in the "Green PowerSwitch" program offered by their utility [company].
 
Last edited by a moderator:


As republished by Ria Novosti from Kommersant
http://en.rian.ru/papers/20091216/157260660.html

Russia affected by Climategate

A discussion of the November 2009 Climatic Research Unit e-mail hacking incident, referred to by some sources as "Climategate," continues against the backdrop of the abortive UN Climate Conference in Copenhagen (COP15) discussing alternative agreements to replace the 1997 Kyoto Protocol that aimed to combat global warming.

The incident involved an e-mail server used by the Climatic Research Unit (CRU) at the University of East Anglia (UEA) in Norwich, East England. Unknown persons stole and anonymously disseminated thousands of e-mails and other documents dealing with the global-warming issue made over the course of 13 years.

Controversy arose after various allegations were made including that climate scientists colluded to withhold scientific evidence and manipulated data to make the case for global warming appear stronger than it is.

Climategate has already affected Russia. On Tuesday, the Moscow-based Institute of Economic Analysis (IEA) issued a report claiming that the Hadley Center for Climate Change based at the headquarters of the British Meteorological Office in Exeter (Devon, England) had probably tampered with Russian-climate data.

The IEA believes that Russian meteorological-station data did not substantiate the anthropogenic global-warming theory.

Analysts say Russian meteorological stations cover most of the country's territory, and that the Hadley Center had used data submitted by only 25% of such stations in its reports.

Over 40% of Russian territory was not included in global-temperature calculations for some other reasons, rather than the lack of meteorological stations and observations.

The data of stations located in areas not listed in the Hadley Climate Research Unit Temperature UK (HadCRUT) survey often does not show any substantial warming in the late 20th century and the early 21st century.

The HadCRUT database includes specific stations providing incomplete data and highlighting the global-warming process, rather than stations facilitating uninterrupted observations.

On the whole, climatologists use the incomplete findings of meteorological stations far more often than those providing complete observations.

IEA analysts say climatologists use the data of stations located in large populated centers that are influenced by the urban-warming effect more frequently than the correct data of remote stations.

The scale of global warming was exaggerated due to temperature distortions for Russia accounting for 12.5% of the world's land mass. The IEA said it was necessary to recalculate all global-temperature data in order to assess the scale of such exaggeration.

Global-temperature data will have to be modified if similar climate-date procedures have been used from other national data because the calculations used by COP15 analysts, including financial calculations, are based on HadCRUT research.

http://en.rian.ru/


Russia Institute Says U.K. Tweaked Data to Exaggerate Warming
By Maria Kolesnikova

Dec. 17 (Bloomberg) -- The Moscow institute founded by a former adviser to Prime Minister Vladimir Putin said the U.K. government manipulated Russian climate data to make a bolder case for global warming than warranted.

Researchers at the Hadley Centre, the climate change research arm of the Met Office, Britain’s national weather service, “purposefully rejected temperature data for 40 percent of our country’s territory,” or about one-eighth of the world’s landmass, the Moscow-based Institute of Economic Analysis said in a report posted on its Web site yesterday.

“The systemic selection of data” by British researchers has exaggerated warming in Russia by 0.64 degree Centigrade, the institute said. Analyzing data for the whole world in the same way could lead to a “significant” overestimation of global warming during the 20th century, the Russian research group said in the report.

The report was edited by Andrei Illarionov, who founded the Institute of Economic Analysis in 1994 to study “the connections between economic growth, economic freedom and political freedoms,” according to its Web site. Illarionov, who is also a senior fellow at the Washington-based Cato Institute, was the Kremlin’s senior economic adviser during Putin’s first term as president. A vocal opponent of the Kyoto protocol, Illarionov quit in 2005 to protest what he said was the state’s increasing role in the economy...

...Illarionov’s institute said its conclusions were based on data made public by the Met Office and the University of East Anglia in Norwich to quell growing criticism over leaked e-mails that appeared to show that some British researchers tweaked or suppressed statistics to silence detractors. In the e-mails, researchers exchanged comments about withholding data from critics seeking to discredit their work...

http://www.bloomberg.com/apps/news?pid=20601095&sid=a3ZVxxSVzSVQ
 
Last edited:
Do your Wall Street buddies receive the same scrutiny as the Copenhagen delegates, or do they get a free pass because they don't believe in GW? How about all those rich CEO's living in huge McMansions, wasting untold amounts of energy heating and cooling their oversized homes? Do they receive the same scrutiny, or are they exempt because they "earned" the right to over-consume by virtue of the free market system? I mean, really Trysail, if you're going to single out one group for being wasteful, while ignoring the rest, it reveals a bias that reflects poorly on your objectivity.

Atmospheric CO2:
mauna-loa-co2-1-percent-scale.jpg


Carbon Capitalists
Wall Street wants a leading role in the new carbon-trading market being designed in Washington. First, executives like JPMorgan’s Blythe Masters must convince skeptics this isn’t just a new trillion-dollar gamble on derivatives.

By Lisa Kassenaar

Across Uganda, thousands of women warm supper over new, $8 orange-painted stoves. The clay-and-metal pots burn about two- thirds the charcoal of the open-fire cooking typical of East Africa, where forests are being chopped down in the struggle to feed the region’s 125 million people.

Four thousand miles away, at the Charles Hurst Land Rover dealership in southwest London, a Range Rover Vogue sells for 90,000 pounds ($151,000). A blue windshield sticker proclaims that the gasoline-powered truck’s first 45,000 miles (72,421 kilometers) will be carbon neutral.

That’s because Land Rover, official purveyor of 4x4s to Queen Elizabeth II, is helping Ugandans cut their greenhouse gas emissions with those new stoves.

These two worlds came together in the offices of Blythe Masters at JPMorgan Chase & Co. Masters, 40, oversees the New York bank’s environmental businesses as the firm’s global head of commodities. JPMorgan brokered a deal in 2007 for Land Rover to buy carbon credits from ClimateCare, an Oxford, England-based group that develops energy-efficiency projects around the world. Land Rover, now owned by Mumbai-based Tata Motors Ltd., is using the credits to offset some of the CO2 emissions produced by its vehicles.

For Wall Street, these kinds of voluntary carbon deals are just a dress rehearsal for the day when the U.S. develops a mandatory trading program for greenhouse gas emissions. JPMorgan, Goldman Sachs Group Inc. and Morgan Stanley will be watching closely as 192 nations gather in Copenhagen next week to try to forge a new climate-change treaty that would, for the first time, include the U.S. and China.

U.S. Cap and Trade
Those two economies are the biggest emitters of CO2, the most ubiquitous of the gases found to cause global warming. The Kyoto Protocol, whose emissions targets will expire in 2012, spawned a carbon-trading system in Europe that the banks hope will be replicated in the U.S.

The U.S. Senate is debating a clean-energy bill that would introduce cap and trade for U.S. emissions. A similar bill passed the House of Representatives in June. The plan would transform U.S. industry by forcing the biggest companies -- such as utilities, oil and gas drillers and cement makers -- to calculate the amounts of carbon dioxide and other greenhouse gases they emit and then pay for them.

Estimates of the potential size of the U.S. cap-and-trade market range from $300 billion to $2 trillion.

Banks Moving In
Banks intend to become the intermediaries in this fledgling market. Although U.S. carbon legislation may not pass for a year or more, Wall Street has already spent hundreds of millions of dollars hiring lobbyists and making deals with companies that can supply them with “carbon offsets” to sell to clients.

JPMorgan, for instance, purchased ClimateCare in early 2008 for an undisclosed sum. This month, it paid $210 million for Eco-Securities Group Plc, the biggest developer of projects used to generate credits offsetting government-regulated carbon emissions. Financial institutions have also been investing in alternative energy, such as wind and solar power, and lending to clean-technology entrepreneurs.

The banks are preparing to do with carbon what they’ve done before: design and market derivatives contracts that will help client companies hedge their price risk over the long term. They’re also ready to sell carbon-related financial products to outside investors.

Masters says banks must be allowed to lead the way if a mandatory carbon-trading system is going to help save the planet at the lowest possible cost. And derivatives related to carbon must be part of the mix, she says. Derivatives are securities whose value is derived from the value of an underlying commodity -- in this case, CO2 and other greenhouse gases.

‘Heavy Involvement’
“This requires a massive redirection of capital,” Masters says. “You can’t have a successful climate policy without the heavy, heavy involvement of financial institutions.”

As a young London banker in the early 1990s, Masters was part of JPMorgan’s team developing ideas for transferring risk to third parties. She went on to manage credit risk for JPMorgan’s investment bank.

Among the credit derivatives that grew from the bank’s early efforts was the credit-default swap. A CDS is a contract that functions like insurance by protecting debt holders against default. In 2008, after U.S. home prices plunged, the cost of protection against subprime-mortgage bond defaults jumped. Insurer American International Group Inc., which had sold billions in CDSs, was forced into government ownership, roiling markets and helping trigger the worst global recession since the 1930s.
 

http://en.wikipedia.org/wiki/Medieval_Warm_Period

http://network.nationalpost.com/np/blogs/fullcomment/archive/2009/12/18/370719.aspx

~~~~~~~~~~~~~~~~~~~~~~~~~~

Wikipedia’s climate doctor
December 19, 2009
How Wikipedia’s green doctor rewrote 5,428 climate articles
By Lawrence Solomon

The Climategate Emails describe how a small band of climatologists cooked the books to make the last century seem dangerously warm.

The emails also describe how the band plotted to rewrite history as well as science, particularly by eliminating the Medieval Warm Period, a 400 year period that began around 1000 AD.

The Climategate Emails reveal something else, too: the enlistment of the most widely read source of information in the world — Wikipedia — in the wholesale rewriting of this history.

The Medieval Warm Period, which followed the meanness and cold of the Dark Ages, was a great time in human history — it allowed humans around the world to bask in a glorious warmth that vastly improved agriculture, increased life spans and otherwise bettered the human condition.

But the Medieval Warm Period was not so great for some humans in our own time — the same small band that believes the planet has now entered an unprecedented and dangerous warm period. As we now know from the Climategate Emails, this band saw the Medieval Warm Period as an enormous obstacle in their mission of spreading the word about global warming. If temperatures were warmer 1,000 years ago than today, the Climategate Emails explain in detail, their message that we now live in the warmest of all possible times would be undermined. As put by one band member, a Briton named Folland at the Hadley Centre, a Medieval Warm Period “dilutes the message rather significantly.”

Even before the Climategate Emails came to light, the problem posed by the Medieval Warm Period to this band was known. “We have to get rid of the Medieval Warm Period” read a pre-Climategate email, circa 1995, as attested to at hearings of the U.S. Senate Committee on Environment & Public Works. But the Climategate transcripts were more extensive and more illuminating — they provided an unvarnished look at the struggles that the climate practitioners underwent before settling on their scientific dogma.

The Climategate Emails showed, for example, that some members of the band were uncomfortable with aspects of their work, some even questioning the need to erase the existence of the Medieval Warm Period 1,000 years earlier.

Said Briffa, one of their chief practitioners: “I know there is pressure to present a nice tidy story as regards ‘apparent unprecedented warming in a thousand years or more in the proxy data’ but in reality the situation is not quite so simple. … I believe that the recent warmth was probably matched about 1,000 years ago.”

In the end, Briffa and other members of the band overcame their doubts and settled on their dogma. With the help of the United Nations Intergovernmental Panel on Climate Change, the highest climate change authority of all, they published what became the icon of their movement — the hockey stick graph. This icon showed temperatures in the last 1,000 years to have been stable — no Medieval Warm Period, not even the Little Ice Age of a few centuries ago.

But the UN’s official verdict that the Medieval Warm Period had not existed did not erase the countless schoolbooks, encyclopedias, and other scholarly sources that claimed it had. Rewriting those would take decades, time that the band members didn’t have if they were to save the globe from warming.

Instead, the band members turned to their friends in the media and to the blogosphere, creating a website called RealClimate.org. “The idea is that we working climate scientists should have a place where we can mount a rapid response to supposedly ‘bombshell’ papers that are doing the rounds” in aid of “combating dis-information,” one email explained, referring to criticisms of the hockey stick and anything else suggesting that temperatures today were not the hottest in recorded time. One person in the nine-member Realclimate.org team — U.K. scientist and Green Party activist William Connolley — would take on particularly crucial duties.

Connolley took control of all things climate in the most used information source the world has ever known – Wikipedia. Starting in February 2003, just when opposition to the claims of the band members were beginning to gel, Connolley set to work on the Wikipedia site. He rewrote Wikipedia’s articles on global warming, on the greenhouse effect, on the instrumental temperature record, on the urban heat island, on climate models, on global cooling. On Feb. 14, he began to erase the Little Ice Age; on Aug.11, the Medieval Warm Period. In October, he turned his attention to the hockey stick graph. He rewrote articles on the politics of global warming and on the scientists who were skeptical of the band. Richard Lindzen and Fred Singer, two of the world’s most distinguished climate scientists, were among his early targets, followed by others that the band especially hated, such as Willie Soon and Sallie Baliunas of the Harvard-Smithsonian Center for Astrophysics, authorities on the Medieval Warm Period.

All told, Connolley created or rewrote 5,428 unique Wikipedia articles. His control over Wikipedia was greater still, however, through the role he obtained at Wikipedia as a website administrator, which allowed him to act with virtual impunity. When Connolley didn’t like the subject of a certain article, he removed it — more than 500 articles of various descriptions disappeared at his hand. When he disapproved of the arguments that others were making, he often had them barred — over 2,000 Wikipedia contributors who ran afoul of him found themselves blocked from making further contributions. Acolytes whose writing conformed to Connolley’s global warming views, in contrast, were rewarded with Wikipedia’s blessings. In these ways, Connolley turned Wikipedia into the missionary wing of the global warming movement.

The Medieval Warm Period disappeared, as did criticism of the global warming orthodoxy. With the release of the Climategate Emails, the disappearing trick has been exposed. The glorious Medieval Warm Period will remain in the history books, perhaps with an asterisk to describe how a band of zealots once tried to make it disappear.
 

By: Peter Lilley, M.P.

... Having studied physics at Cambridge I do not for a moment doubt the existence of the greenhouse effect. Without the warm blanket provided by greenhouse gases—mainly water vapor and carbon dioxide—the earth would be a frozen uninhabitable rock. If the amount of CO2 is doubled, the direct effect—other things being equal—would be to raise the Earth's temperature by about one degree Centigrade. Since warmer air holds more water vapor, that could double the impact—or reduce it if the resultant clouds reflect more sunshine.

But to move from the modest but scientifically well-founded range of 0.5 to 2.0 degrees Centigrade to catastrophic impacts on human life requires successively more uncertain layers of conjecture. Higher temperature projections are obtained by constructing elaborate computer models that build in complex feedbacks that amplify warming and assume nothing could dampen these effects—both tendentious and unproven assumptions. Then, even more unwarranted assumptions must be adopted about the impact of higher temperatures on sea levels, hurricane frequency, disease propagation, and so on (glossing over the fact that it would take centuries for higher temperatures to melt the ice caps sufficiently to raise sea levels substantially)

Finally, heroic assumptions are necessary about low discount rates to maximize the present value of future benefits from cutting carbon, and that decarbonizing industry will be cheap. Meanwhile, the supposed damages from climate change must be aggregated over centuries to prove that we need to remove CO2 immediately rather than adapt to change. Far too little attention is given to measures to help the poorest and most vulnerable countries adapt, rather than spending huge sums to prevent what may not occur.

The tendency of those committed to the theory of catastrophic man-made global warming to unquestioningly adopt the assumptions, at every stage, that maximize the expectation of calamity should alert us that groupthink is driving the movement.

The recently leaked email exchanges between scientists at the Climatic Research Unit in East Anglia and their colleagues in the U.S., who are among the illuminati of the global warming movement, show vivid evidence of groupthink at work. These scientists have become so committed to a cause that they think it natural to perform "tricks" to "hide the decline," as one email says. Another is so upset by "The fact… that we can't account for the lack of warming at the moment and it is a travesty that we can't" that he suggests "the data are surely wrong." It is reminiscent of the German philosopher Hegel who, on being told by his disciples that the facts refuted his scientific theories, replied: "So much the worse for the facts." It is clear that while governments think they are pursuing evidence-based policies, these institutes have been serving up "policy-based evidence."

The whole U.N. Intergovernmental Panel on Climate Change process could not be better designed to institutionalize groupthink on a global scale. It puts enthusiasts at the helm. It seeks to establish a single view on the science, modeling, and economics. Dissent is banished. Loyalty is demanded. Silence is deemed consent. Moral fervor is reinforced by massive cash research budgets.

Even the British parliament has become caught up in groupthink. Dissent (and there are silent skeptics in both Labour and Conservative ranks) is suppressed by equating skepticism with Holocaust denial. Moral zeal replaces reasoned debate. Scrutiny of costs and benefits of alternative policy options is suspended. Desirable policies such as nuclear power to reduce dependency on hydrocarbons are sidelined in favor of a whimsical dependency on wind and sunshine.

When the Climate Change Bill passed through parliament last year, I read the cost benefit assessment ministers are obliged to produce for any bill. Amazingly, it put the potential costs (of reducing carbon emissions by 60%) at £205 billion ($331 billion)—yet the maximum benefits (of reduced climate change damage) were estimated at only £110 billion. This is the first time any government had asked parliament to support a bill that its own figures say will do more harm than good. Yet just five of us voted against it. At least I had the satisfaction of pointing out that while the House was voting for a bill based on the assumption the world is getting warmer, it was snowing in London in October for the first time in 74 years. I was told, "extreme cold is a symptom of man made global warming."

The absurdity did not end there. Because the target for reducing emissions was amended upwards to 80%, I asked for a new cost-benefit assessment. Ministers eventually slipped one out—long after the bill had become an Act. It showed that the cost of meeting this more onerous target had doubled to £400 billion. Yet, miraculously, the government estimate of the likely benefits had risen tenfold. They had apparently previously mislaid nearly £1 trillion of benefits. It would be hard to find clearer evidence of the flaky nature of figures governments employ to justify their commitment to climate-change policies.

More carried away by groupthink than his colleagues, Gordon Brown has strutted his stuff in Copenhagen—the prime minister of a near-bankrupt country offering to bankroll a global deal. When he returns we will find that although the benefits are flaky, the costs are real.


Recommended Reading— The Skeptics Handbook:
http://joannenova.com.au/globalwarming/the_skeptics_handbook_2-3_lq.pdf
There are two ways of supporting or disproving theories. The first is by experimental observation, the second is by theoretical analysis. The first has been discussed endlessly in relation to AGW on this site and others. Let me offer an attempt at the second approach.

As a preamble however I would like to point out that the study of the absorption of radiant energy by matter is NOT climatology, it is spectroscopy. In fact most of the science behind climatology is derived from other disciplines thus it is not justifiable to take the view that only input from climatologists is relevant. In my case, I have spent the last 33 years very successfully carrying out research for a major spectroscopy company.

Having become interested in the AGW issue I tried to derive the direct effect of CO2 from first principles. What I found was that the relationship between CO2 concentration and retained energy was logarithmic and that each doubling of CO2 would retain about an additional 3.5 watts/sq meter. Consulting the literature I find that the logarithmic relationship is widely established, I simply re-derived an already known relationship. As to the magnitude, the 4th (ie: latest) IPCC report states that the increase in CO2 concentration from 280 to 390 ppm has increased retained energy by 1.77 watts/sq meter. 280 to 390 ppm represents 0.48 doublings so the IPCC number is 1.77/0.48 or 3.7 watts/sq meter. Pretty reasonable agreement. That means the increase from 390 to 560 ppm – a further 0.52 doublings will increase retained energy by 1.9 watts/sq meter. Using Stefan’s law relating temperature with energy radiated by a black body (known and proven for more than a century) an additional 1.9 watts/sq meter will increase the temperature of earth’s surface by about 0.34 degrees C. That’s a long way from the claimed 3+ degrees C – how come? The claimed answer is positive feedback from water vapour. My immediate thought on hearing this was to note that every single naturally stable system I can think of exhibits net negative feedback so to suggest that climate (which is clearly stable) exhibits strong positive feedback makes me very suspicious, however suspicion is not evidence so lets look at the numbers.

To get 3 degrees temperature rise requires an additional 16.5 watts/sq meter (again from Stefan’s law). If 1.9 comes from CO2, the remainder, 14.6 must come from water vapour. That would mean the positive feedback co-efficient was 14.6/16.5 or 0.88 (where 1 = runaway) WOW. Looking up the relationship between temperature and water vapour pressure in the CRC handbook I find that a 3 degree temperature increase results in approximately a 30% increase in water vapour concentration (at constant relative humidity). The logarithmic relationship applies to all greenhouse gases including water thus a 30% increase is 0.38 doublings implying that each doubling of water vapour contributes an additional 14.6/.38 watts or 38 watts/sq meter. To put this in perspective, water vapour at present only contributes 84 watts/sq meter in total. A sensitivity as large as this raises many extremely serious paradoxes and is, I believe absolutely impossible. This post is already too long for me to enumerate these but if anyone is interested I am more than willing to outline some of the paradoxes in a subsequent posting.

The models making this prediction also predict that the impact of this water vapour feedback mechanism is a hot spot in the tropics at an altitude of about 8 km. According to the models, if the positive feedback effect of water is true then this region should be warming at least 2 times as fast as the surface. However again when I read the literature I find that 1000’s of balloon measurements and the satellite measurements all fail to find such a hot spot- and in fact this region is warming significantly less than the surface. The prediction is not supported experimentally suggesting the original hypothesis is false.

The above only considers positive feedback from water vapour but in fact water vapour also generates very powerful negative feedback. Atmospheric water vapour gives rise to clouds and they cause cooling because they reflect incoming energy from the sun back into space. For Earth the albedo is dominated by clouds. At present it is about 0.3 which means that 30% of the incoming energy from the sun is reflected back into space (about 100 watts/sq meter- which is greater in magnitude but opposite in sign to the greenhouse impact of water vapour 84 watts/sq meter). So to consider one without the other is biased thinking.

What is the relationship between water vapour concentration and cloud levels? I admit I don’t know for sure but I suspect it is much closer to linear than logarithmic. If there are two opposite feedback mechanisms of similar magnitude, one varying logarithmically with concentration and the other linearly, linear will dominate as the concentration rises. This again suggests feedback from water vapour is more likely to be negative than positive. If so, the direct 0.34 degree rise from an increase of CO2 to 560 ppm would be reduced not increased by the impact of water vapour.

There is also experimental evidence easily observable by any lay person that the feedback from water vapour is negative...


See also:
http://joannenova.com.au/2008/10/the-missing-hotspot/

http://joannenova.com.au/global-warming/

 
Last edited:

The Unbearable Complexity of Climate

By: Willis Eschenbach

I keep reading statements in various places about how it is indisputable “simple physics” that if we increase amount of atmospheric CO2, it will inevitably warm the planet. Here’s a typical example:

In the hyperbolic language that has infested the debate, researchers have been accused of everything from ditching the scientific method to participating in a vast conspiracy. But the basic concepts of the greenhouse effect is a matter of simple physics and chemistry, and have been part of the scientific dialog for roughly a century.

Here’s another:

The important thing is that we know how greenhouse gases affect climate. It has even been predicted hundred years ago by Arrhenius. It is simple physics.

Unfortunately, while the physics is simple, the climate is far from simple. It is one of the more complex systems that we have ever studied. The climate is a tera-watt scale planetary sized heat engine. It is driven by both terrestrial and extra-terrestrial forcings, a number of which are unknown, and many of which are poorly understood and/or difficult to measure. It is inherently chaotic and turbulent, two conditions for which we have few mathematical tools.

The climate is comprised of five major subsystems — atmosphere, ocean, cryosphere, lithosphere, and biosphere. All of these subsystems are imperfectly understood. Each of these subsystems has its own known and unknown internal and external forcings, feedbacks, resonances, and cyclical variations. In addition, each subsystem affects all of the other subsystems through a variety of known and unknown forcings and feedbacks.

Then there is the problem of scale. Climate has crucially important processes at physical scales from the molecular to the planetary, and at temporal scales from milliseconds to millennia.

As a result of this almost unimaginable complexity, simple physics is simply inadequate to predict the effect of a change in one of the hundreds and hundreds of things that affect the climate. I will give two examples of why “simple physics” doesn’t work with the climate — a river, and a block of steel. I’ll start with a thought experiment with the block of steel.

Suppose that I want to find out about how temperature affects solids. I take a 75 kg block of steel, and I put the bottom end of it in a bucket of hot water. I duct tape a thermometer to the top end in the best experimental fashion, and I start recording how the temperature change with time. At first, nothing happens. So I wait. And soon, the temperature of the other end of the block of steel starts rising. Hey, simple physics, right?

To verify my results, I try the experiment with a block of copper. I get the same result, the end of the block that’s not in the hot water soon begins to warm up. I try it with a block of glass, same thing. My tentative conclusion is that simple physics says that if you heat one end of a solid, the other end will eventually heat up as well.

So I look around for a final test. Not seeing anything obvious, I have a flash of insight. I weigh about 75 kg. So I sit with my feet in the bucket of hot water, put the thermometer in my mouth, and wait for my head to heat up. This experimental setup is shown in Figure 1 above.

After all, simple physics is my guideline, I know what’s going to happen, I just have to wait.

And wait … and wait …

As our thought experiment shows, simple physics may simply not work when applied to a complex system. The problem is that there are feedback mechanisms that negate the effect of the hot water on my cold toes. My body has a preferential temperature which is not set by the external forcings.

For a more nuanced view of what is happening, let’s consider the second example, a river. Again, a thought experiment.

I take a sheet of plywood, and I cover it with some earth. I tilt it up so it slopes from one edge to the other. For our thought experiment, we’ll imagine that this is a hill that goes down to the ocean.

I place a steel ball at the top edge of the earth-covered plywood, and I watch what happens. It rolls, as simple physics predicts, straight down to the lower edge. I try it with a wooden ball, and get the same result. I figure maybe it’s because of the shape of the object.

So I make a small wooden sled, and put it on the plywood. Again, it slides straight down to the ocean. I try it with a miniature steel shed, same result. It goes directly downhill to the ocean as well. Simple physics, understood by Isaac Newton.

As a final test, I take a hose and I start running some water down from the top edge of my hill to make a model river. To my surprise, although the model river starts straight down the hill, it soon starts to wander. Before long, it has formed a meandering stream, which changes its course with time. Sections of the river form long loops, the channel changes, loops are cut off, new channels form, and after while we get something like this:

oxbow-lakes1.png

Figure 2. Meanders, oxbow bends, and oxbow lakes in a river system. Note the old channels where the river used to run.

The most amazing part is that the process never stops. No matter how long we run the river experiment, the channel continues to change. What’s going on here?

Well, the first thing that we can conclude is that, just as in our experiment with the steel block, simple physics simply doesn’t work in this situation. Simple physics says that things roll straight downhill, and clearly, that ain’t happening here … it is obvious we need better tools to analyze the flow of the river.

Are there mathematical tools that we can use to understand this system? Yes, but they are not simple. The breakthrough came in the 1990’s, with the discovery by Adrian Bejan of the Constructal Law. The Constructal Law applies to all flow systems which are far from equilibrium, like a river or the climate.

It turns out that these types of flow systems are not passive systems which can take up any configuration. Instead, they actively strive to maximize some aspect of the system. For the river, as for the climate, the system strives to maximize the sum of the energy moved and the energy lost through turbulence. See the discussion of these principles here, here, here, and here.
http://memagazine.asme.org/Articles/2009/september/Natural_Design_Constructal.cfm
http://www.mems.duke.edu/bejan-constructal-theory
http://www.treehugger.com/files/2006/12/constructal_the.php
http://homepage.mac.com/williseschenbach/.Public/Constructal_Climate.pdf

There is also a website devoted to various applications of the Constructal Law here. http://www.constructal.org/

There are several conclusions that we can make from the application of the Constructal Law to flow systems:

1. Any flow system far from equilibrium is not free to take up any form as the climate models assume. Instead, it has a preferential state which it works actively to achieve.

2. This preferential state, however, is never achieved. Instead, the system constantly overshoots and undershoots that state, and does not settle down to one final form. The system never stops modifying its internal aspects to move towards the preferential state.

3. The results of changes in such a flow system are often counterintuitive. For example, suppose we want to shorten the river. Simple physics says it should be easy. So we cut through an oxbow bend, and it makes the river shorter … but only for a little while. Soon the river readjusts, and some other part of the river becomes longer. The length of the river is actively maintained by the system. Contrary to our simplistic assumptions, the length of the river is not changed by our actions.

So that’s the problem with “simple physics” and the climate. For example, simple physics predicts a simple linear relationship between the climate forcings and the temperature. People seriously believe that a change of X in the forcings will lead inevitably to a chance of A * X in the temperature. This is called the “climate sensitivity”, and is a fundamental assumption in the climate models. The IPCC says that if CO2 doubles, we will get a rise of around 3C in the global temperature. However, there is absolutely no evidence to support that claim, only computer models. But the models assume this relationship, so they cannot be used to establish the relationship.

However, as rivers clearly show, there is no such simple relationship in a flow system far from equilibrium. We can’t cut through an oxbow to shorten the river, it just lengthens elsewhere to maintain the same total length. Instead of being affected by a change in the forcings, the system sets its own preferential operating conditions (e.g. length, temperature, etc.) based on the natural constraints and flow possibilities and other parameters of the system.

Final conclusion? Because climate is a flow system far from equilibrium, it is ruled by the Constructal Law. As a result, there is no physics-based reason to assume that increasing CO2 will make any difference to the global temperature, and the Constructal Law gives us reason to think that it may make no difference at all. In any case, regardless of Arrhenius, the “simple physics” relationship between CO2 and global temperature is something that we cannot simply assume to be true.
 
Major Philippine Volcano May Be On The Verge of Erupting

http://www.phivolcs.dost.gov.ph/index.php?option=com_content&task=view&id=279&Itemid=1

30 December 2009 7:00 AM
For the past 24 hours, one ash explosion occurred at Mayon Volcano (13.2576 N, 123.6856 E). The explosion produced a dirty white ash column that rose to about 100 meters above the summit and drifted to the northwest. Lava continued to flow down along the Bonga-Buyuan, Miisi and Lidong gullies. The lava front has now reached about 5.9 kilometers from the summit along the Bonga-Buyuan gully.

Mayon Volcano’s seismic network recorded 16 volcanic earthquakes. A total of 150 rock fall events related to the detachment of lava fragments at the volcano’s upper slopes was also detected by the seismic network. Yesterday’s measurement of Sulfur Dioxide (SO2) emission rate yielded an average value of 4,397 tonnes per day (t/d). The volcano edifice remains inflated as indicated by the electronic tilt meter installed at the northeast sector of the volcano.

The status of Mayon Volcano is maintained at Alert Level 4. PHIVOLCS-DOST reiterates that the Extended Danger Zone (EDZ) from the summit of 8-km on the southern sector of the volcano and 7-km on the northern sector should be free from human activity. Areas just outside of this EDZ should prepare for evacuation in the event hazardous eruptions intensify. Active river channels and those perennially identified as lahar prone in the southern sector should also be avoided especially during bad weather conditions or when there is heavy and prolonged rainfall. In addition, Civil Aviation Authorities must advise pilots to avoid flying close to the volcano’s summit as ejected ash and volcanic fragments from sudden explosions may pose hazards to aircrafts. PHIVOLCS–DOST is closely monitoring Mayon Volcano’s activity and any new significant development will be immediately posted to all concerned.

Mt.Mayon_tam3rd.jpg
STS083-747-88.jpg
 
Last edited:
http://www.drroyspencer.com/2009/12/what-if-there-was-no-greenhouse-effect/

What If There Was No Greenhouse Effect?
December 31st, 2009
by: Roy W. Spencer, Ph. D.

The climate of the Earth is profoundly affected by two competing processes: the greenhouse effect, which acts to warm the lower atmosphere and cool the upper atmosphere, and atmospheric convection (thermals, clouds, precipitation) which does just the opposite: cools the lower atmosphere and warms the upper atmosphere.

To better understand why this happens, it is an instructive thought experiment to ask the question: What if there was no greenhouse effect? In other words, what if there were no infrared absorbers such as water vapor and carbon dioxide in the atmosphere?

While we usually only discuss the greenhouse effect in the context of global warming (that is, the theory that adding more carbon dioxide to the atmosphere will lead to higher temperatures in the lower atmosphere), it turns out that the greenhouse effect has a more fundamental role: there would be no weather on Earth without the greenhouse effect.

First, the big picture: The Earth surface is warmed by sunlight, and the surface and atmosphere together cool by infrared radiation back to outer space. And just as a pot of water warming on the stove will stop warming when the rate of energy gained by the pot from the stove equals the rate of energy loss by the pot to its surroundings, an initially cold Earth would stop warming when the rate at which solar energy is absorbed equals the rate at which infrared energy is lost by the whole Earth-atmosphere system to space.

So, let’s imagine an extremely cold Earth and atmosphere, without any water vapor, carbon dioxide, methane or any other greenhouse gases – and with no surface water to evaporate and create atmospheric water vapor, either. Next, imagine the sun starts to warm the surface of the Earth. As the surface temperature rises, it begins to give off more infrared energy to outer space in response.

That’s the Earth’s surface. But what would happen to the atmosphere at the same time? The cold air in contact with the warming ground would also begin to warm by thermal conduction. Convective air currents would transport this heat upward, gradually warming the atmosphere from the bottom up. Importantly, this ‘dry convection’ will result in a vertical temperature profile that falls off by 9.8 deg. C for every kilometer rise in altitude, which is the so-called ‘adiabatic lapse rate’. This is because rising warm air parcels cool as they expand at the lower air pressures aloft, and the air that sinks in response to all of that rising air must warm at the same rate by compression.

Eventually, the surface and lower atmosphere would warm until the rate at which infrared energy is lost by the Earth’s surface to space would equal the rate at which sunlight is absorbed by the surface, and the whole system would settle into a fairly repeatable day-night cycle of the surface heating (and lower atmosphere convecting) during the day, and the surface cooling (and a shallow layer of air in contact with it) during the night.

The global-average temperature at which this occurs would depend a lot on how reflective the Earth’s surface is to sunlight in our thought experiment. ..it could be anywhere from well below 0 deg F for a partially reflective Earth to about 45 deg. F for a totally black Earth.

So, how is this different from what happens in the real world? Well, notice that what we are left with in this thought experiment is an atmosphere that is heated from below by the ground absorbing sunlight, but the atmosphere has no way of cooling…except in a very shallow layer right next to the ground where it can cool by conduction at night.

Why is this lack of an atmospheric cooling mechanism important? Because in our thought experiment we now have an atmosphere whose upper layers are colder than the surface and lower atmosphere. And what happens when there is a temperature difference in a material? Heat flows by thermal conduction, which would then gradually warm the upper atmosphere to reduce that temperature difference. The process would be slow, because the thermal conductivity of air is quite low. But eventually, the entire atmosphere would reach a constant temperature with height.

Only the surface and a shallow layer of air next to the surface would go through a day-night cycle of heating and cooling. The rest of the atmosphere would be at approximately the same temperature as the average surface temperature. And without a falloff of temperature with height in the atmosphere of at least 10 deg. C per kilometer, all atmospheric convection would stop.

Since it is the convective overturning of the atmosphere that causes most of what we recognize as ‘weather’, most weather activity on Earth would stop, too. Atmospheric convective overturning is what causes clouds and rainfall. In the tropics, it occurs in relatively small and strongly overturning thunderstorm-type weather systems.

At higher latitudes, that convection occurs in much larger but more weakly overturning cloud and precipitation systems associated with low pressure areas.

There would probably still be some horizontal wind flows associated with the fact that the poles would still be cooler than the tropics, and the day-night heating cycle that moves around the Earth each day. But for the most part, most of what we call ‘weather’ would not occur. The same is true even if there was surface water and water vapor…but if we were able to somehow ‘turn off’ the greenhouse effect of water vapor. Eventually, the atmosphere would still become ‘isothermal’, with a roughly constant temperature with height.

Why would this occur? Infrared absorbers like water vapor and carbon dioxide provide an additional heating mechanism for the atmosphere. But at least as important is the fact that, since infrared absorbers are also infrared emitters, the presence of greenhouse gases allow the atmosphere — not just the surface — to cool to outer space.

When you pile all of the layers of greenhouse gases in the atmosphere on top of one another, they form a sort of radiative blanket, heating the lower layers and cooling the upper layers. (For those of you who have heard claims that the greenhouse effect is physically impossible, see my article here:
http://www.drroyspencer.com/2009/04/in-defense-of-the-greenhouse-effect/
There is a common misconception that the rate at which a layer absorbs IR energy must equal the rate at which it loses IR energy, which in general is not true.)

Without the convective air currents to transport excess heat from the lower atmosphere to the upper atmosphere, the greenhouse effect by itself would make the surface of the Earth unbearably hot, and the upper atmosphere (at altitudes where where jets fly) very much colder than it really is.

Thus, it is the greenhouse effect that continuously de-stabilizes the atmosphere, ‘trying’ to create a temperature profile that the atmosphere cannot sustain, which then causes all different kinds of weather as the atmosphere convectively overturns. Thus, the greenhouse effect is actually required to explain why weather occurs.

This is what makes water such an amazing substance. It cools the Earth’s surface when it evaporates, it warms the upper atmosphere when it re-condenses to form precipitation, it warms the lower atmosphere through the greenhouse effect, and it cools the upper atmosphere by emitting infrared radiation to outer space (also part of the greenhouse effect process). These heating and cooling processes are continuously interacting, with each limiting the influence of the other.

As Dick Lindzen alluded to back in 1990 [ see below ], while everyone seems to understand that the greenhouse effect warms the Earth’s surface, few people are aware of the fact that weather processes greatly limit that warming. And one very real possibility is that the 1 deg. C direct warming effect of doubling our atmospheric CO2 concentration by late in this century will be mitigated by the cooling effects of weather to a value closer to 0.5 deg. C or so (about 1 deg. F.) This is much less than is being predicted by the UN’s Intergovernmental Panel on Climate Change or by NASA’s James Hansen, who believe that weather changes will amplify, rather than reduce, that warming.


~~~~~~~~~~~~~~~~~~~~~~~~
http://www-eaps.mit.edu/faculty/lindzen/cooglobwrm.pdf

Some Coolness Concerning Global Warming

by: Richard S. Lindzen, Ph.D.
Center for Meteorology and Physical Meteorology
Massachusetts Institute of Technology
Cambridge, Massachusetts 02139

1. Introduction
The assessment of the proper response to the possible danger of global warming depends critically on the determination of how real the danger is. There are certainly other potential problems that could be far more devastating to life on this planet (e.g., an asteroid collision), but we regard those as too unlikely to worry about.

The existence of skepticism on this issue has only recently been publicly recognized. Whatever the truth may turn out to be, there is an unusual degree of extremism associated with this issue. While environmental scares are not unheard of, few have been accompanied by recommendations that skepticism be stifled (an editorial to this effect in the Boston Globe [ 17 December, 1989 ] is but one of a series of examples). As an admitted skeptic on this issue, I would like to discuss some aspects of the "greenhouse hypothesis" that leave me unconvinced, and leave me concerned whether unanimity on such an issue is healthy for meteorology.

2. Observations of increased CO2 and rising temperature...


http://www-eaps.mit.edu/faculty/lindzen/cooglobwrm.pdf
 
changing-artic_monthly_wx_review.png


On CO2 residence times, fossil fuel contributions and mass balance:
http://www.greenworldtrust.org.uk/Science/Scientific/Segalstad.htm
Regarding pH and oceans and a paper on the problem with ice core data:
http://www.warwickhughes.com/icecore/zjmar07.pdf
Water vapor as a positive or negative feedback mechanism:
http://www.drroyspencer.com/wp-cont...rcing-Feedback-AGU-09-San-Francisco-final.pdf
Growth of the Antarctic icesheet:
http://www.sciencemag.org/cgi/content/abstract/308/5730/1898


Temperature records from NASA's
Goddard Institute for Space Studies:

Fort Smith, NWT, Canada
http://data.giss.nasa.gov/cgi-bin/g...py?id=403719340000&data_set=1&num_neighbors=1

Coppermine, NWT, Canada
http://data.giss.nasa.gov/cgi-bin/g...py?id=403719380005&data_set=1&num_neighbors=1

Anadyr, Siberia, Russia
http://data.giss.nasa.gov/cgi-bin/g...py?id=222255630007&data_set=1&num_neighbors=1

Markovo, Siberia, Russia
http://data.giss.nasa.gov/cgi-bin/g...py?id=222255510000&data_set=1&num_neighbors=1

Punta Arenas, Argentina
http://data.giss.nasa.gov/cgi-bin/g...py?id=304859340004&data_set=1&num_neighbors=1

San Antonio, Chile
http://data.giss.nasa.gov/cgi-bin/g...py?id=301877840003&data_set=1&num_neighbors=1

Amundsen-Scot, Antarctica
http://data.giss.nasa.gov/cgi-bin/g...py?id=700890090008&data_set=1&num_neighbors=1

Davis, Antarctica
http://data.giss.nasa.gov/cgi-bin/g...py?id=700895710008&data_set=1&num_neighbors=1

Christchurch, New Zealand
http://data.giss.nasa.gov/cgi-bin/g...py?id=507937800000&data_set=1&num_neighbors=1

Hokitika Aero, New Zealand
http://data.giss.nasa.gov/cgi-bin/g...py?id=507936150000&data_set=1&num_neighbors=1


Splicing data series:
http://nber-nsf09.ucdavis.edu/program/papers/auffhammer.pdf


The DelMarVa peninsula— 'twixt land and sea:

http://www.appinsys.com/GlobalWarmi...72402003x42572404003x42572404004x42574595002x


great-global-warming-blunder-pdo-2000-2008-5monavg.jpg


c13-analysis-results.jpg


Water-vapor climate feedback inferred from climate fluctuations, 2003–2008:
http://www.agu.org/pubs/crossref/2008/2008GL035333.shtml


759324400_BjmZq-M.jpg
 
Last edited:

Association is not causation.

Which came first: the chicken or the egg?

The fact that CO2 levels have risen does not explain changes in temperature. It's one thing to speculate; it's another thing to prove cause and effect. That hasn't been done. Warming isn't proof that greenhouse gases caused the warming.

No one has explained the increase in levels of CO2. Isotope analysis suggests the origin of only a small portion ( a third or less ) of the rise but the remainder is completely unexplained. The modelers and the theorists haven't had the intellectual honesty to admit that they do not understand the climate system. Trenberth finally did ( but only sotto voce in one of his now-famous whistleblown East Anglia emails ).

Climatology is too full of members unwilling to confess that the field's understanding of earth's climate is, at best, primitive. From lapse rates to climate sensitivity to the role of the very largest greenhouse gas, unknowns abound.

The paleoclimatological record confirms that much higher levels of CO2 did not produce a planetary hothouse. For the past half million years, temperature changes preceded CO2 levels. If CO2 was a major driver, temperatures would have risen indefinitely in a runaway greenhouse effect. They didn't. Either some unknown factor stops the runaway greenhouse effect or CO2 is a minor force. In either case, CO2 is trivial.


Atmospheric Temperature and Carbon Dioxide: Feedback or Equilibrium?

R. Taylor

For several years, the suggestion that there is positive feedback between atmospheric temperature (T) and carbon-dioxide concentration (CO2) has dominated the scientific literature, and has become a fundamental assumption of climate science. Alternatively, the relationship between T and CO2 might be one of equilibrium. We can test models of each type by comparison with the Vostok record, first published by Petit, et al. (1999). The Vostok record contains about 3,300 determinations of T and 280 determinations of CO2, spanning the last 420,000 years.

Figure 1 shows the Vostok record; for clarity, the dates and measurements of T have been averaged in groups of 10, and those after 0 BCE are not shown (cf. Figure 4).

rtaylorfig11.png

Figure 1: Temperature and Carbon Dioxide Inferred from the Vostok Ice-core.

T ranges through about 13 °C in the record, and CO2 ranges through about 120 ppm. There are peaks and valleys of various amplitudes and durations, and changes in T precede corresponding changes in CO2 (Mudelsee, 2001). The resolution of the record improves as measurements become more recent.

The first quantitative model comparable to the Vostok record with feedback between T and CO2 seems to be that of Hogg (2008). Hogg simulated insolation and other factors over a given interval of 500,000 years to predict values of T and CO2. Figure 2 is rescaled from Hogg’s figure 2a, so T and CO2 have approximately equal amplitude.

rtaylorfig2.png

Figure 2: Temperature and Carbon Dioxide from Hogg’s Feedback-Model.

Feedback systems typically have characteristic amplitude and period. For this model, 1.7 °C is the characteristic amplitude of T, and 100,000 years is about the characteristic period. Adjusting the parameters of the model will change its amplitude and period, but these will be characteristic for any given set of parameters: Other amplitudes and periods will be suppressed.

Since the model assumes that CO2 has a significant effect on T, changes in CO2 happen before corresponding changes in T through a substantial portion of its cycle, viz. the latter portion of the rises to the peaks (cf. Hogg) and through essentially all of the subsequent declines. As previously mentioned, however, the Vostok record shows that changes in CO2 happen after corresponding changes in T. This lag is shown most clearly by large-amplitude features in the more recent portion of the record: CO2 rises hundreds of years after T rises, and falls thousands of years after T falls.

The substantially inverted lag of this feedback model confirms what is self-evident in an equilibrium model: A lagging entity can have no significant effect on a leading entity. For example, CO2 at a given time cannot affect the level of T that existed hundreds-to-thousands of years earlier.

A model of equilibrium between T and CO2 can be based on balance between temperature dependent processes that (i) release CO2 into the atmosphere and (ii) absorb it into the surface of the earth. If the temperature dependency is simply linear, we can express our model as:

CO2(t+l) = mT(t) + b

where t is time, l is the length of time required for CO2 to regain equilibrium after a change in T, m is the number of units that CO2 changes for a unit change in T, and b is the constant offset between units of CO2 and units of T.

Using this equation, we can predict a value for CO2 at some time in the future from each value of T. If we give l a value of 50 years after a rise in temperature and 8000 years after a fall in temperature, m a value of 10 and b a value of 270, and average the times and predicted values of CO2 in groups of 10, we obtain the predicted values shown in figure 3. The figure also shows the measured values of CO2 for comparison.

rtaylorfig3.png

Figure 3: Carbon Dioxide, Measured and Predicted by Lagged Temperature.

The output of the equilibrium model is consistent with the lag, spectrum and amplitudes of the record. The correspondence between predicted and measured values of CO2 indicates that CO2 is in temperature-dependent time-lagged equilibrium, and that the temperature dependence of CO2 is essentially linear through the Vostok range.

Let us turn our attention to the last 11,000 years, during which humans have disturbed the equilibrium between T and CO2. The most recent CO2 determination from the ice-core has a date of about 340 BCE. We can add an early-industrial-era value of 290 ppm at 1800 CE and a value of 365 ppm at 2000 CE to provide figure 4. The scaling in the figure is consistent with the equilibrium model that fits the overall Vostok record, where a change of 1 °C in T causes a change of 10 ppm in CO2.

rtaylorfig4.png

Figure 4: Temperature and Carbon Dioxide since 9,000 BCE.

T and CO2 appear to have been in equilibrium until about 3,000 BCE. Over the 5,000 years since then, CO2 has risen increasingly above its natural equilibrium. By 1,800 CE, CO2 had risen to a level comparable to the highest in the Vostok record. During this time, T declined at a rate of 0.1 °C per thousand years, indicating again that CO2 has no apparent effect on T. The trends of this 5,000-year interval of excess CO2 are consistent with the equilibrium model, in which T is independent of CO2.

The last 5,000 years are trivial compared to the 420,000 years of the Vostok record; of even less significance are the last 1,200 years. However, climate science has put great emphasis on the features of this interval, even though they fit within the noise-envelope. The “medieval warm period” spanned 800 CE to 1,200 CE; Vostok shows it wasn’t really warm, but wasn’t really cold either. The “little ice age” followed (although average T was barely lower), and ended after the low of -1.84 °C around 1,770 CE. By the early 1800s, T was higher than it is at present, and it has fluctuated within levels typical of the last 11,000 years since then. It is remarkable that climate hysteria should be based on noise-level changes in T over the last 200 years, which is an eye-blink in the Vostok record. It seems to be the superstition of our time.

In summary, the Vostok record indicates that CO2 is in lagged equilibrium with T and that, for the range of T in Vostok, the dependency of CO2 on T is essentially linear. Unnaturally high CO2 for the last 5,000 years has had no apparent effect on T. This empirical evidence supports a conclusion that there cannot be any significant feedback between CO2 and T. Such feedback would cause predicted T and CO2 to show fundamental disagreement with the lag, spectrum and amplitudes evident in the Vostok record.

It is impossible to say how enduring the feedback fallacy will be. However, any such model proposed in the future can be regarded as qualitative if it does not specify lag, characteristic amplitude and period, and as speculative if it cannot be compared to the Vostok record. Accordingly, any such model can be ignored.

If we may depart for a moment from objectivity, any such model should be ignored if its proponents declare that it shows polar bears are in peril, and you can save them by painting your roof white and burning nuts and corn in your car.

References
Hogg, A.M., 2008, Glacial cycles and carbon dioxide: A conceptual model. Geophysical Research Letters, 35, L01701 (5 pp.).

Mudelsee, M., 2001, The phase relations among atmospheric CO2 content, temperature and global ice volume over the past 420 ka. Quaternary Science Reviews, 20, 583-589. Petit, J.R., Jouzel, J., Raynaud, D., Barkov, N.I., Barnola, J.-M., Basile, I., Bender, M., Chappellaz, J., Davis, M., Delaygue, G., Delmotte, M., Kotlyakov, V.M., Legrand, M., Lipenkov, V.Y., Lorius, C., Pépin, L., Ritz, C., Saltzman, E. and Stievenard, M., 1999, Climate and atmospheric history of the past 420,000 years from the Vostok ice core, Antarctica. Nature, 399, 429-436. http://www.ncdc.noaa.gov/paleo/icecore/antarctica/vostok/vostok_data.html provides on-line data.

=======================================================
 
http://bigjournalism.com/pcourrielc...g-of-a-new-science-movement-part-i/#more-2358


Peer-to-Peer Review: How ‘Climategate’ Marks the Maturing of a New Science Movement, Part I

How a tiny blog and a collective of climate enthusiasts broke the biggest story in the history of global warming science – but not without a gatekeeper of the climate establishment trying to halt its proliferation.

by Patrick Courrielche

It was triggered at the most unlikely of places. Not in the pages of a prominent science publication, or by an experienced muckraker. It was triggered at a tiny blog – a bit down the list of popular skeptic sites. With a small group of followers, a blog of this size could only start a media firestorm if seeded with just the right morsel of information, and found by just the right people. Yet it was at this location that the most lethal weapon against the global warming establishment was unleashed.

The blog was the Air Vent. The information was a link to a Russian server that contained 61 MB of files now known as Climategate. Within two weeks of the file’s introduction, the story appeared on 28,400,000 web pages.

Not entirely the “death of global warming” as many have claimed – what happened with Climategate is much more nuanced and exponentially more interesting than the headlines convey. What was triggered at this blog was the death of unconditional trust in the scientific peer review process, and the maturing of a new movement – that of peer-to-peer review.

This development may horrify the old guard, but peer-to-peer review was just what forced the release of the Climategate files – and as a consequence revealed the uncertainty of the science and the co-opting of the process that legitimizes global warming research. It was a collective of climate blogs, centered on the work of Stephen McIntyre and Ross McKitrick, which applied the pressure. With moderators and blog commenters that include engineers, PhDs, statistics whizzes, mathematic experts, software developers, and weather specialists – the label flat-earthers, as many of their opponents have attempted to brand them, seems as fitting as tagging Lady Gaga with the label demure.

This peer-to-peer review network is the group that applied the pressure and then helped authenticate and proliferate the story.

Now, as expected, the virtual organism that is the global warming establishment resisted release of the weapon. At the first appearance of the Climategate files, which contained a plethora of emails and documents from the University of East Anglia’s Climate Research Unit, the virtual organism moved to halt their promulgation. Early on, a few of the emails were posted on Lucia Liljegren’s skeptic blog The Blackboard. Shortly after the post, Lucia, a PhD and specialist in fluid mechanics, received an email from prominent climatologist Gavin Schmidt from the NASA Goddard Institute for Space Studies (GISS). It said in part, “[A] word to the wise… I don’t think that bloggers are shielded under any press shield laws and so, if I were you, I would not post any content, nor allow anyone else to do so.”

In response to my inquiry about his email, Schmidt posited, “I was initially concerned that she might be in legal jeopardy in posting the stolen emails.” Gavin Schmidt was included in over 120 of the leaked correspondence.

Gavin Schmidt
When asked if she thought the Climategate documents were a big deal at first sight, Lucia responded, “Yes. In fact, I was even more sure after Gavin [Schmidt] sent me his note.”

Remember these names: Steven Mosher, Steve McIntyre, Ross McKitrick, Jeff “Id” Condon, Lucia Liljegren, and Anthony Watts. These, and their community of blog commenters, are the global warming contrarians that formed the peer-to-peer review network and helped bring chaos to Copenhagen – critically wounding the prospects of cap-and-trade legislation in the process. One may have even played the instrumental role of first placing the leaked files on the Internet...


*****

Continued at: http://bigjournalism.com/pcourrielc...g-of-a-new-science-movement-part-i/#more-2358
 
A Demonstration that Global Warming Predictions are Based More On Faith than On Science
January 12th, 2010
by Roy W. Spencer, Ph. D.


I’m always searching for better and simpler ways to explain the reason why I believe climate researchers have overestimated the sensitivity of our climate system to increasing carbon dioxide concentrations in the atmosphere.

What follows is a somewhat different take than I’ve used in the past. In the following cartoon, I’ve illustrated 2 different ways to interpret a hypothetical (but realistic) set of satellite observations that indicate (1) warming of 1 degree C in global average temperature, accompanied by (2) an increase of 1 Watt per sq. meter of extra radiant energy lost by the Earth to space.

Three-cases-global-forcing-feedback.jpg


The ‘consensus’ IPCC view, on the left, would be that the 1 deg. C increase in temperature was the cause of the 1 Watt increase in the Earth’s cooling rate. If true, that would mean that a doubling of atmospheric carbon dioxide by late in this century (a 4 Watt decrease in the Earth’s ability to cool) would eventually lead to 4 deg. C of global warming. Not good news.

But those who interpret satellite data in this way are being sloppy. For instance, they never bother to investigate exactly WHY the warming occurred in the first place. As shown on the right, natural cloud variations can do the job quite nicely. To get a net 1 Watt of extra loss you can (for instance) have a gain of 2 Watts of forcing from the cloud change causing the 1 deg. C of warming, and then a resulting feedback response to that warming of an extra 3 Watts.

The net result still ends up being a loss of 1 extra Watt, but in this scenario, a doubling of CO2 would cause little more than 1 deg. C of warming since the Earth is so much more efficient at cooling itself in response to a temperature increase.

Of course, you can choose other combinations of forcing and feedback, and end up deducing just about any amount of future warming you want. Note that the major uncertainty here is what caused the warming in the first place. Without knowing that, there is no way to know how sensitive the climate system is.

And that lack of knowledge has a very interesting consequence. If there is some forcing you are not aware of, you WILL end up overestimating climate sensitivity. In this business, the less you know about how the climate system works, the more fragile the climate system looks to you. This is why I spend so much time trying to separately identify cause (forcing) and effect (feedback) in our satellite measurements of natural climate variability.

As a result of this inherent uncertainty regarding causation, climate modelers are free to tune their models to produce just about any amount of global warming they want to. It will be difficult to prove them wrong, since there is as yet no unambiguous interpretation of the satellite data in this regard. They can simply assert that there are no natural causes of climate change, and as a result they will conclude that our climate system is precariously balanced on a knife edge. The two go hand-in-hand.

Their science thus enters the realm of faith. Of course, there is always an element of faith in scientific inquiry. Unfortunately, in the arena of climate research the level of faith is unusually high, and I get the impression most researchers are not even aware of its existence.
 
http://www.judicialwatch.org/news/2...-documents-related-global-warming-controversy

Judicial Watch Uncovers NASA Documents Related to Global Warming Controversy

NASA Scientists Go on Attack After Climate Data Error Exposed
Contact Information:
Press Office 202-646-5172, ext 305

Washington, DC -- January 14, 2010
Judicial Watch, the public interest group that investigates and prosecutes government corruption, announced today that it has obtained internal documents from NASA's Goddard Institute for Space Studies (GISS) related to a controversy that erupted in 2007 when Canadian blogger Stephen McIntyre exposed an error in NASA's handling of raw temperature data from 2000-2006 that exaggerated the reported rise in temperature readings in the United States. According to multiple press reports, when NASA corrected the error, the new data apparently caused a reshuffling of NASA's rankings for the hottest years on record in the United States, with 1934 replacing 1998 at the top of the list.

These new documents, obtained by Judicial Watch through the Freedom of Information Act (FOIA), include internal GISS email correspondence as NASA scientists attempted to deal with the media firestorm resulting from the controversy. In one exchange GISS head James Hansen tells a reporter from Bloomberg that NASA had not previously published rankings with 1998 atop the list as the hottest year on record in the 20th century.

Email from Demian McLean, Bloomberg to Jim Hansen, August 14, 2007: "The U.S. figures showed 1998 as the warmest year. Nevertheless, NASA has indeed newly ranked 1934 as the warmest year..."

Email Response from James Hansen to Demian McLean, August 14, 2007: "...We have not changed ranking of warmest year in the U.S. As you will see in our 2001 paper we found 1934 slightly warmer, by an insignificant hair over 1998. We still find that result. The flaw affected temperatures only after 2000, not 1998 and 1934."

Email from NASA Scientist Makiko Sato to James Hansen, August 14, 2007: "I am sure I had 1998 warmer at least once on my own temperature web page..." (Email includes temperature chart dated January 1, 2007.)

(This issue also crops up in email communications with New York Times reporter Andrew Revkin a little over a week later.)

According to the NASA email, NASA's incorrect temperature readings resulted from a "flaw" in a computer program used to update annual temperature data.

Hansen, clearly frustrated by the attention paid to the NASA error, labeled McIntyre a "pest" and suggests those who disagree with his global warming theories "should be ready to crawl under a rock by now." Hansen also suggests that those calling attention to the climate data error did not have a "light on upstairs."

"This email traffic ought to be embarrassing for NASA. Given the recent Climategate scandal, NASA has an obligation to be completely transparent with its handling of temperature data. Instead of insulting those who point out their mistakes, NASA scientists should engage the public in an open, professional and honest manner," stated Judicial Watch President Tom Fitton.
 

A review of A. W. Montford's The Hockey Stick Illusion:
This is a thriller about codebreaking – not Napoleon's or Hitler's codes, but computer codes that generated a false signal to the world about runaway global warming. Like most codebreaking it was painfully slow but Montford keeps the drama pacy as the years pass, while he explains the intricacies in the plainest possible language. By military codebreaking, the likes of Scovell and Turing helped to change the course of history, and McIntyre and McKitrick should soon do the same, when the statistical fudges that misled the politicians become more widely known.

Nigel Calder
Former editor, New Scientist
co-author, The Chilling Stars

 
Back
Top